FIGURE 4:
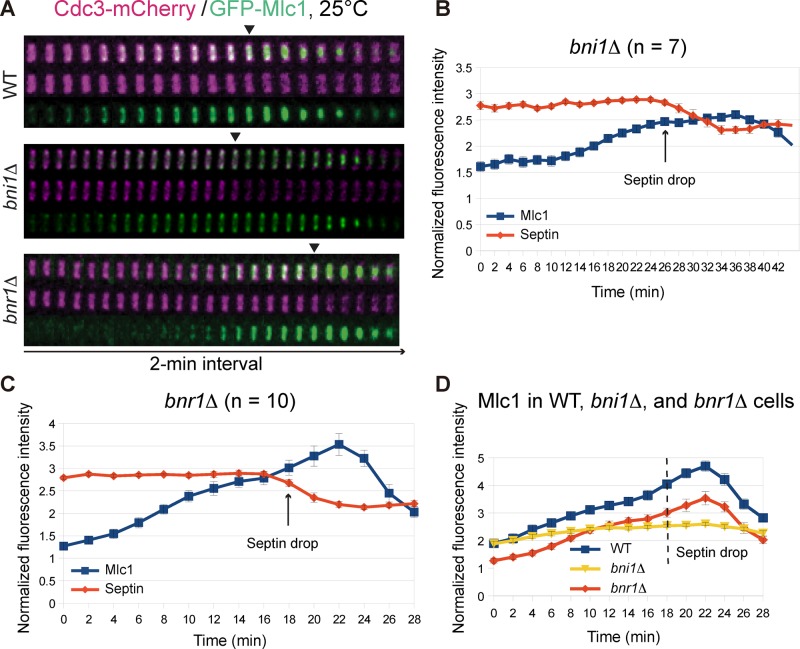
Increase of Mlc1 at the bud neck during cytokinesis depends on the formin Bni1, not Bnr1. (A) Time‑lapse analysis of Mlc1 and Cdc3 at the bud neck during the cell cycle in WT (YEF7070; GFP‑MLC1 CDC3‑mCherry), bni1Δ (YEF7201; bni1Δ GFP‑MLC1 CDC3‑mCherry), and bnr1Δ (YEF7200; bnr1Δ GFP‑MLC1 CDC3‑mCherry) cells. (B, C) Fluorescence intensities of Mlc1 and Cdc3 at the bud neck in bni1Δ (YEF7201; B) and bnr1Δ (YEF7200; C) cells plotted over time. (D) Direct comparison of Mlc1 localization profiles at the bud neck of WT, bni1Δ, and bnr1Δ cells. All cells were grown in SC‑Leu medium at 25°C. Arrows (B, C) and dashed line (D) indicate beginning of the septin‑intensity drop during the cell cycle.

