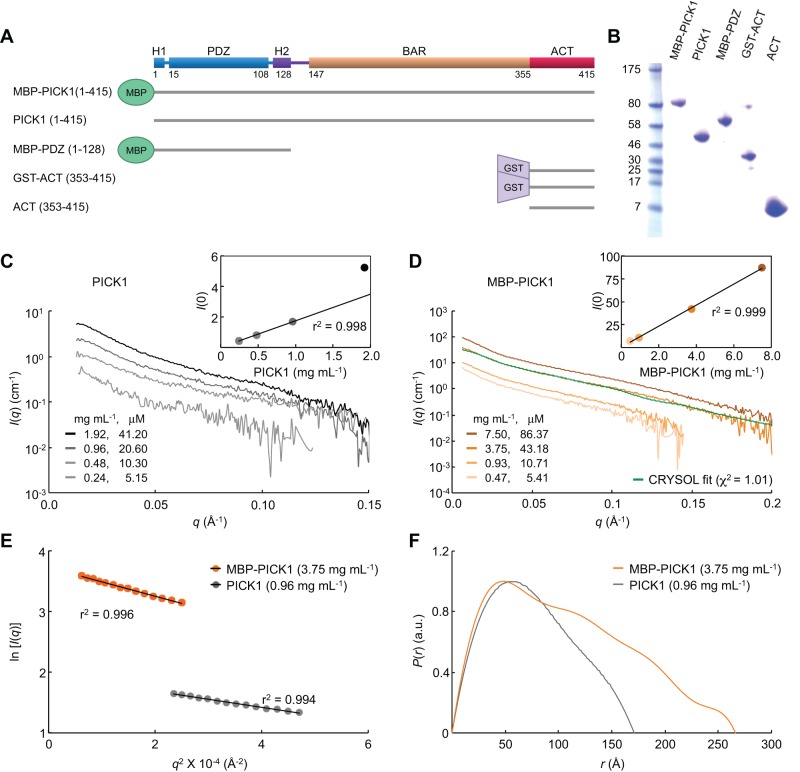
FIGURE 1:
X-ray scattering analysis of PICK1. (A) Domain diagram of PICK1 and description of constructs. (B) SDS–PAGE analysis of the PICK1 proteins used in this study. (C, D) X-ray scattering intensity plotted vs. momentum transfer for different PICK1 and MBP-PICK1 concentrations (as indicated). Insets show the scattering intensity dependence on protein concentration. A linear dependence is indicative of lack of aggregation. The green trace in D corresponds to the scattering curve calculated from the model. (E) Guinier plots of PICK1 and MBP-PICK1 calculated from the scattering data at the indicated sample concentration (color coded). (F) Normalized distance distribution functions of PICK1 and MBP-PICK1.

