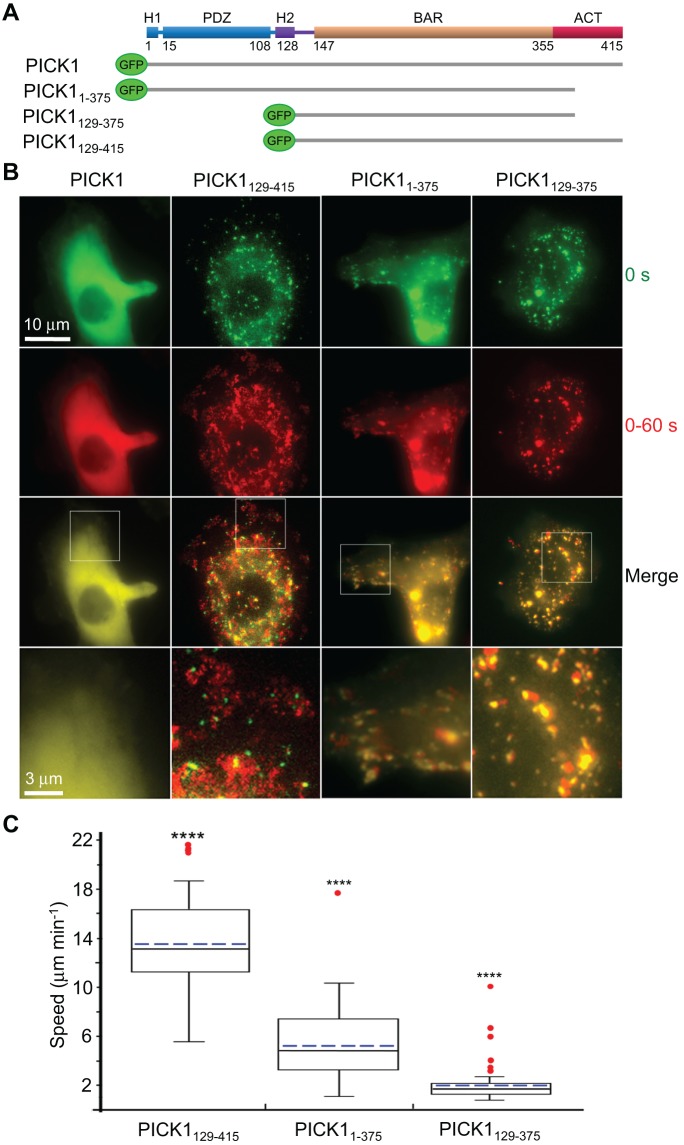
FIGURE 3:
PICK1 plays a role in intracellular organelle motility. (A) Schematic representation of the GFP-fusion constructs expressed in cells. (B) Time-lapse fluorescence microscopy analysis of organelle motility in HeLa cells expressing the indicated PICK1 constructs. First row, first frame of time-lapse sequence. Second row, maximum projection of frames 1–20 taken at 3-s intervals, showing all locations visited by the organelles during 60 s. Third row, overlay of the first two rows (see Supplemental Movie S4). Fourth row, zooms of the regions boxed in the third row. The amount of red signal (maximum projections) relative to green signal (original organelle positions) reflects the extent of organelle motility. (C) Quantification of the speeds of vesicles associated with PICK1 constructs. Data are shown as box-and-whisker plots: the boxes comprise the middle half and the whiskers the 10th–90th percentile of the data, and solid black and dashed blue lines represent median and mean values, respectively. Data outliers are indicated by red dots. All the data sets are statistically different from each other (p < 0.0001, n = 31–49 tracks from three or four cells).

