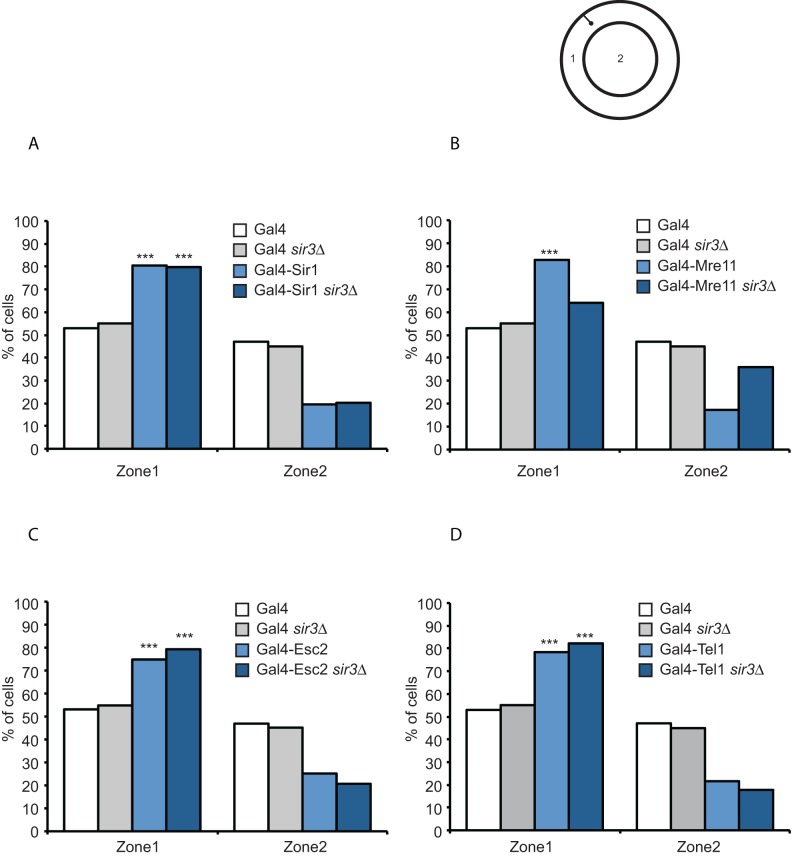
FIGURE 9:
Localization of the modified HMR locus in the yeast nucleus. A schematic of a yeast nucleus with two zones of equal surface area and a fluorescent locus are shown in the line diagram. (A–D) Graphs of the percentage of cells in each of the two zones in various strains. The data for Gal4 DNA–binding domain alone are shown simply for ease of comparison. ***p < 0.001 by χ2 test.

