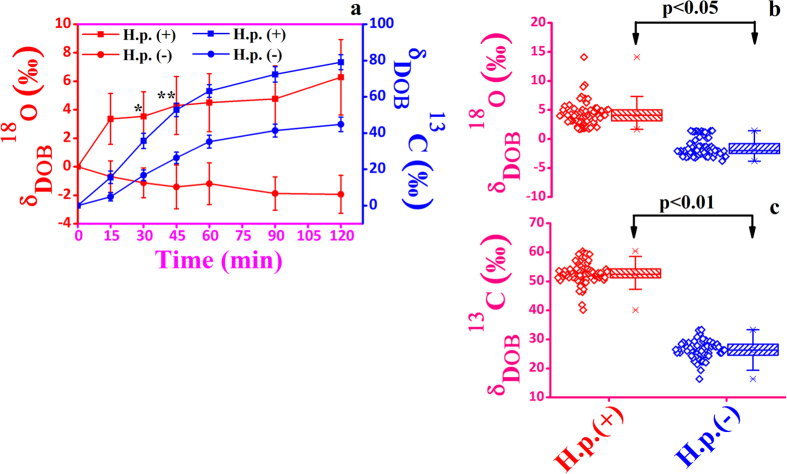
Figure 1. Comparisons of δDOB 18O‰ and δDOB 13C‰ values of exhaled breath CO2 associated with 13C-labelled glucose metabolism in presence [H. p. (+)] and absence [H. p. (−)] of H. pylori infection.
(a) Excretion kinetics of δDOB18O‰ and δDOB13C‰ values for H. pylori positive [H. p. (+)] and H. pylori negative [H. p. (−)] individuals up to 120 minutes. (b,c) The Box-Whiskers plots demonstrating a statistically significant differences of δDOB18O‰ [p < 0.05] and δDOB13C‰ [p < 0.01] values at 45 minutes between H. pylori positive [H. p. (+)] and H. pylori negative [H. p. (−)] individuals. *p < 0.05 and **p < 0.01. Data are means ± SE.

