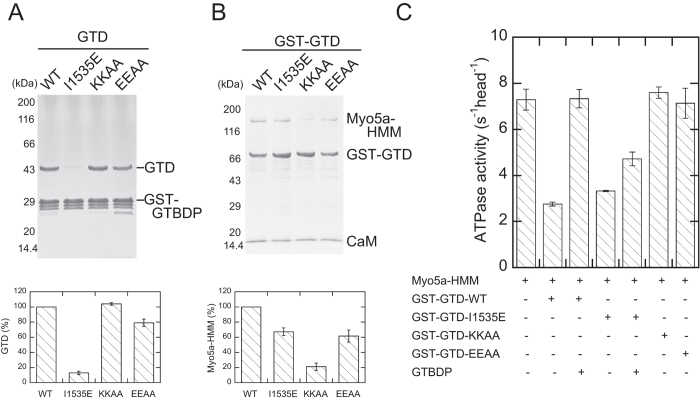
Figure 4. The GTD uses distinct regions to interact with Mlph-GTBDP and the head of Myo5a.
(A) The GST pull-down of GST-Mlph-GTBDP with GTD. (B) The GST pull-down of GST-GTD with Myo5a-HMM. The amount of pull-downed GTD (A) or Myo5a-HMM (B) was determined by scanning densitometry (NIH imageJ program) and normalized with the density of GST-GTBDP (A) or GST-GTD (B). The values (as percentage of WT) shown are means +/− SD from three independent experiments. (C) Inhibition of the Myo5a-HMM ATPase activity by GST-GTD with or without Mlph-GTBDP. The ATPase assays were conducted in the presence of 40 μM actin, 0 or 0.5 μM GST-GTD, and 0 or 20 μM Mlph-GTBDP. The values shown are means +/− SD from three independent experiments. KKAA, K1706A/K1779A; EEAA, E1789A/E1791A.

