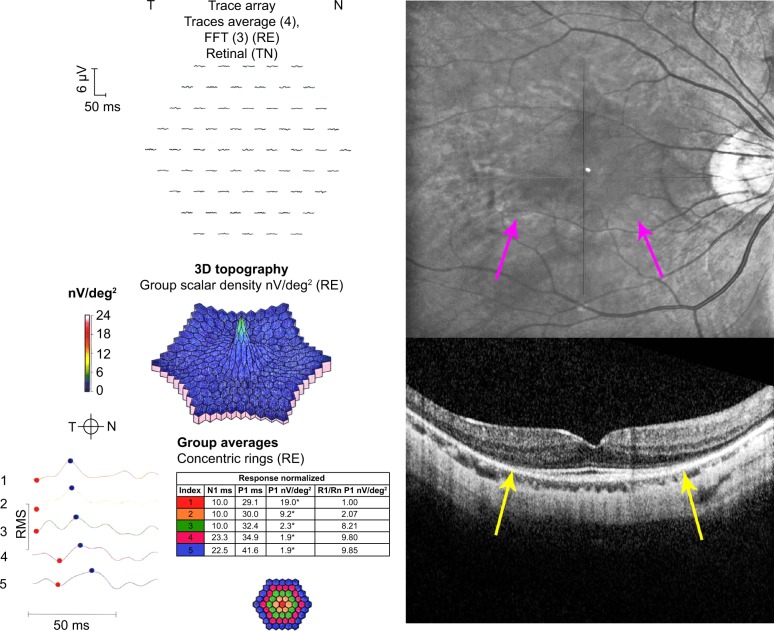
Figure 4.
Monochromatic fundus photography, multifocal electroretinography (mfERG), and spectral domain optical coherence tomography (SD-OCT).
Notes: The images are for the patient taking hydroxychloroquine with retinopathy. The fundus photograph shows an inferior incomplete annular hypopigmented zone (purple arrows). The mfERG shows reduced amplitudes in rings R1–R3. The SD-OCT shows loss of the photoreceptors, RPE, and outer nuclear layer thinning in the perifoveal zone (yellow arrows).
Abbreviations: FFT, fast fourier transform; RE, right eye; T, temporal; N, nasal; TN, temporal-nasal; N1, implicit time of the initial negative wave trough; P1, implicit time of the initial positive wave peak; R1, ring 1; Rn, ring n; RMS, root mean square; RPE, retinal pigment epithelium.

