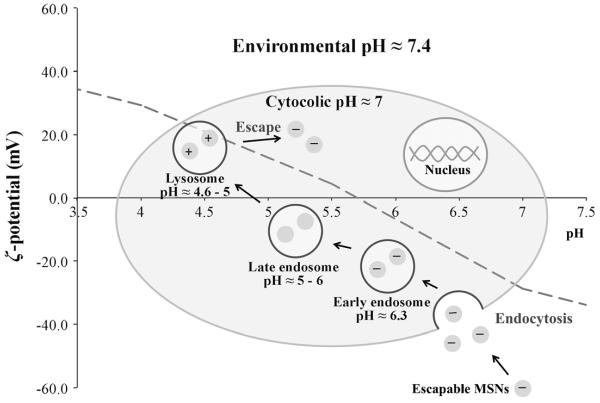
Figure 6.
A schematic model of the endo/lysosomal escape process. The red pH profile shown is that of the optimised escapable nanoparticle, type (4). Particles initially exhibit a negative surface charge at pH≈7.4. After endocytosis, they are entrapped in acidic early endosomes (pH≈6.3) and then late endosomes (pH≈5–6), during which their surface charge becomes increasingly positively charged. When late endosomes fuse into lysosomes (pH≈4.6–5) the particle surface is highly cationic and escape occurs (see arrow indications in Figure 5c).

