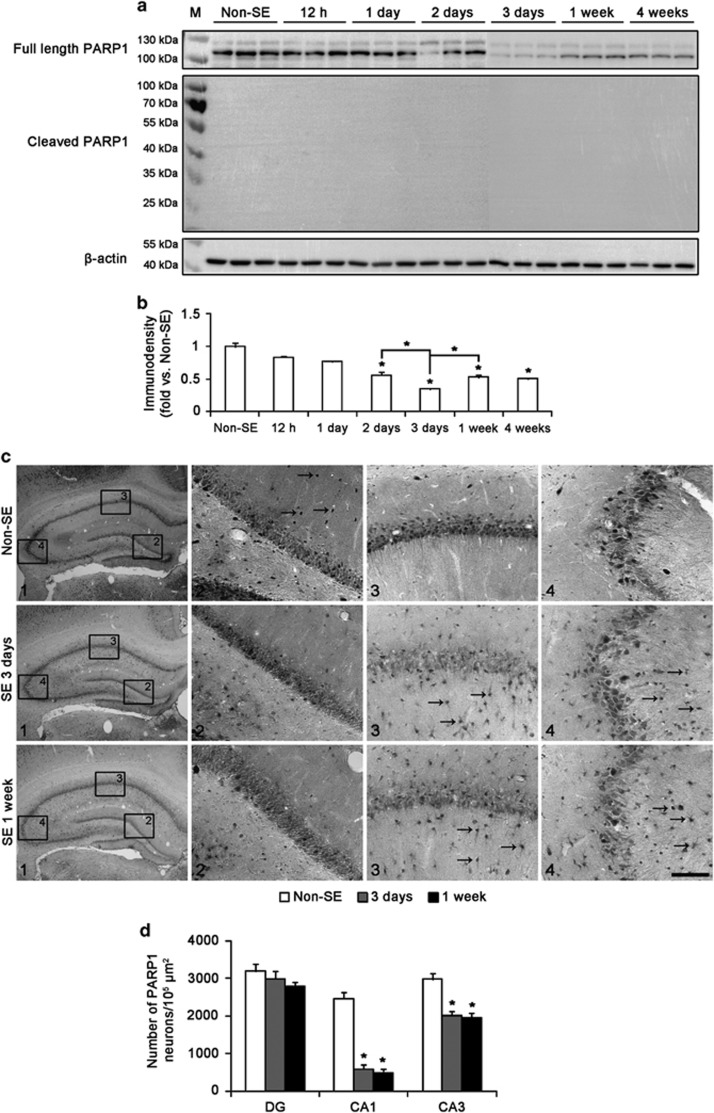
Figure 1.
PARP1 expression in the hippocampus following SE. (a) Western blot shows the gradual downregulation of full length of PARP1 protein without cleavage until 3 days after SE. At 1 and 4 weeks after SE, the expression of full length of PARP1 protein is increased as compared with 3 days after SE in the hippocampus. Cleaved PARP1 band is not observed in this region. (b) Quantification of full-length PARP1 protein levels (means±S.E.M., n=5, respectively). *P<0.05 versus non-SE animals (one-way ANOVA test). (c) SE-induced PARP1 immunoreactivities in the hippocampus. Following SE, the number of PARP1-positive neurons is reduced in the CA1 and CA3 region, but not in dentate granule cell layer. In the molecular layer of the dentate gyrus, PARP1 expression is detected in some non-neuronal cells (arrows). Following SE, PARP1 expression in non-neuronal cells is undetectable in the molecular layer of the dentate gyrus. In contrast, PARP1 expression is increased in non-neuronal cells in the CA1–3 regions following SE (arrows). Panels 2–4 are the high-magnification photos of rectangles in panel 1. Bar=400 μm (panel 1) and 50 μm (panels 2 and 3). (d) The changes in the number of PARP1-positive neurons in the hippocampus (means±S.D., n=5, respectively). *P<0.05 versus non-SE animals (one-way ANOVA test)

