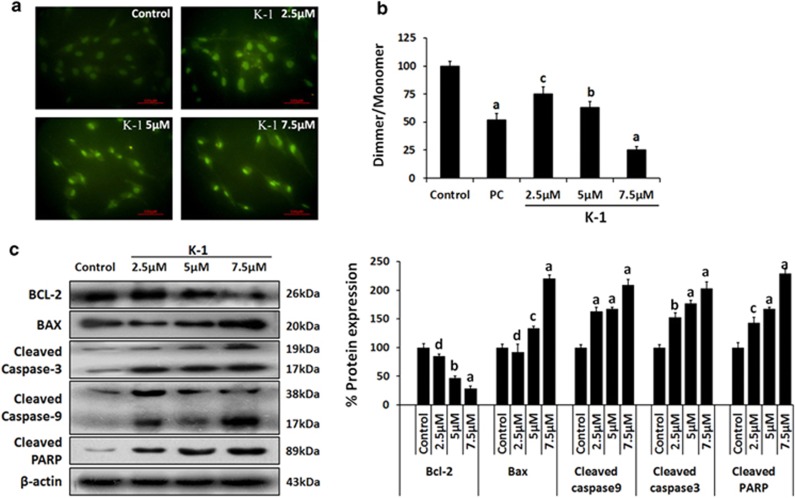
Figure 7.
Effect of K-1 on TUNEL staining, expression of markers of apoptosis in primary endometrial hyperplasial cells. (a) Primary endometrial hyperplasial cells were treated with vehicle, 2.5, 5 and 7.5 μM of the compound K-1 for 24 h. Cells were fixed, permeabilized and the procedure was followed as described in Materials and Methods. Representative figures stained for TUNEL showing a large number of TUNEL-positive cells (greenish yellow) in K-1-treated groups in a concentration-dependent manner. Cell images were grasped using a Nikon fluorescence microscope at × 40. (b) Cells were treated with vehicle, or compound K-1 at 2.5, 5 and 7.5 μM concentrations, for 24 h. Mitochondrial membrane potential was measured by normalization of the 590 : 530 nm JC-1 emission ratios and then normalized to untreated cells. Results are expressed as mean±S.E.M., n=3.± S.E.M., P values are a-P<0.001, b-P<0.01, c-P<0.05 and d-P>0.05 versus control. (c) Cells were treated with the indicated concentrations of compound for 48 h, and 35 μg whole cell lysate in each lane was probed for the expression of Bcl-2,Bax, cleaved caspase3/9 and cleaved PARP using specific antibodies. β-actin was used as a control to correct for loading. Representative blots are shown (left panel) and densitometric quantitation of protein expression levels are shown as fold changes (right panel). Data are expressed as mean of three different experiments;±S.E.M., P values are a-P<0.001, b-P<0.01, c-P<0.05 and d-P>0.05 versus control

