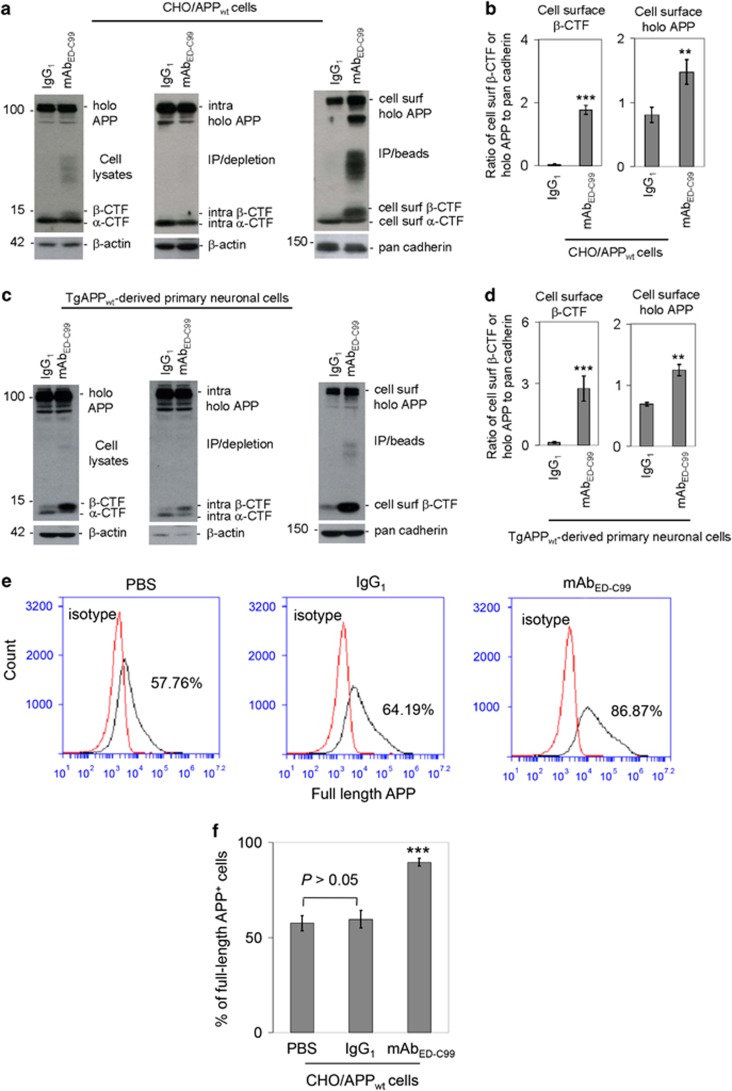
Figure 4.
Cell surface β-CTF and full-length APP are increased following treatment with mAbED-C99. (a) CHO/APPwt cells in 24-well plates (5 × 10⁵/well) were treated with mAbED-C99 or IgG1 isotype control at 1.25 μg/ml for 2 h, washed three times with PBS-CM, and then cell lysate portions of these cells were directly subjected to WB analysis using pAb751/770 (left panels). The remaining cells were biotinylated with Sulfo-NHS-LC-Biotin, quenched with NH4Cl-PBS-CM, lysed, and immunoprecipitated (IP) using Neutravidin beads. The intracellular proteins obtained by IP/Neutravidin depletion (middle panels) and the cell surface (cell surf) proteins obtained by IP/Neutravidin precipitation (right panels) were subjected to WB analysis using pAb751/770. As shown below each panel, as an internal control, β-actin was analyzed for cell lysates and intracellular (intra) proteins and pan cadherin was analyzed for total cell surface proteins. (b) For WB quantitative analysis, band density ratios of cell surface β-CTF or full-length APP to pan cadherin were analyzed and presented as mean±S.D. (**P<0.01, ***P<0.001). The WB data are representative of three independent experiments with similar results. (c) Primary neuronal cells were cultured from cortical tissues of 1-day-old TgAPPwt mouse pups and replated in 24-well plate at 2 × 10⁵/well overnight. These primary neuronal cells were treated with mAbED-C99 or IgG1 isotype control at 1.25 μg/ml for 2 h, washed three times with PBS-CM and then cell lysates were directly subjected to WB analysis using pAb751/770 (left panels). The remaining cells were biotinylated, immunoprecipitated with Neutravidin beads, and then subjected to isolation of intracellular and cell surface proteins. The intracellular proteins obtained by IP/Neutravidin depletion (middle panels) and the cell surface (cell surf) proteins obtained by IP/Neutravidin isolation (right panels) were subjected to WB analysis using pAb751/770. (d) For WB quantitative analysis, band density ratios of cell surface β-CTF or holo APP to pan cadherin were analyzed and presented as mean±S.D. (**P<0.01, ***P<0.001). These WB data are representative of two independent experiments with similar results. (e) Flow cytometry analysis of cell surface APP utilizing a rabbit anti-N-terminal APP antibody. (f) Percentage of full-length APP-positive cells are presented as mean±S.D. (***P<0.001)

