Figure 2.
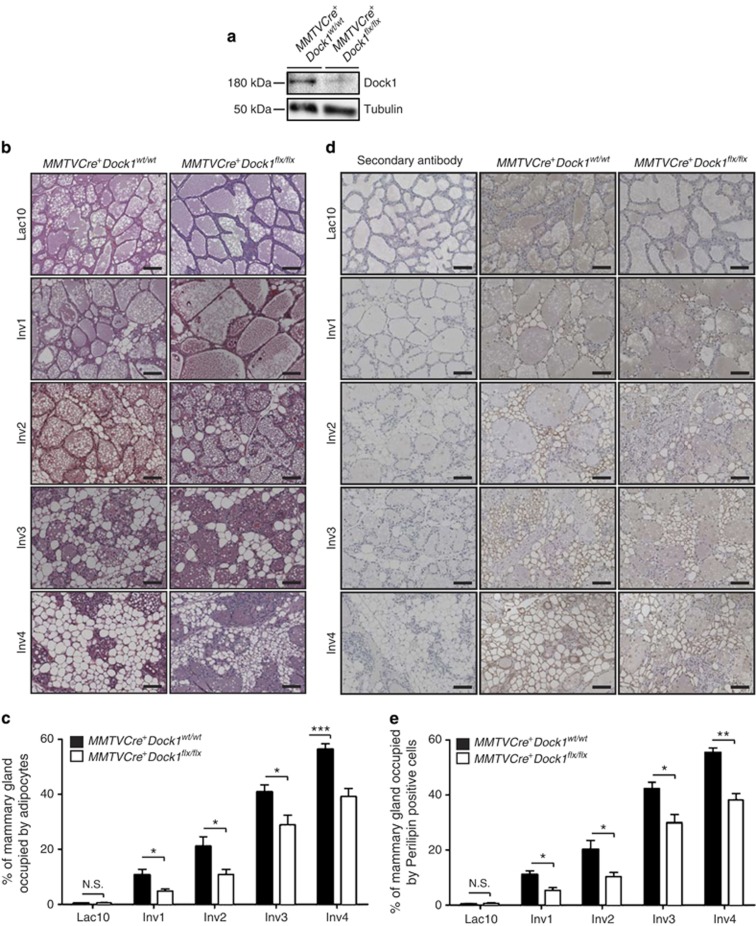
Mammary gland involution is delayed in MMTVCre+Dock1flx/flx mice. (a) Western blot analysis demonstrating the absence of Dock1 expression in Lac10 mammary glands of MMTVCre+Dock1flx/flx mice. (b) H&E staining of mammary glands at 10 days of lactation and after 1, 2, 3 or 4 days of involution showing delayed repopulation of adipocytes in MMTVCre+Dock1flx/flx mice (scale bar: 100 μm, × 20). (c) Average percentage of the area occupied by adipocytes at the indicated lactation and involution days in MMTVCre+Dock1wt/wt and MMTVCre+Dock1flx/flx mammary gland. Twenty random sections were analyzed and quantified from each mouse (n=6). Data were shown as mean±S.E.M. The indicated P-values were calculated by using a two-tailed Student's t-test. NS, not significant, *P≤0.05 and ***P≤0.001. (d) IHC analysis showing Perilipin staining in mammary glands at 10 days of lactation and after 1, 2, 3 and 4 days of involution showing delayed repopulation of adipocytes in MMTVCre+Dock1flx/flx mice (scale bar: 100 μm, × 20). (e) Average percentage of the area occupied by Perilipin-positive at the indicated lactation and involution days in MMTVCre+Dock1wt/wt and MMTVCre+Dock1flx/flx mice. Ten random sections were analyzed and quantified from each mouse (n=3). Data were shown as mean±S.E.M. The indicated P-values were calculated by using a two-tailed Student's t-test. NS, not significant, *P≤0.05 and **P≤0.01

