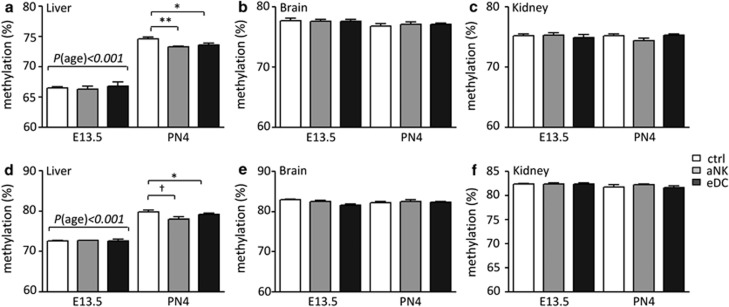
Figure 3.
Global methylation levels as determined by LUMA and pyrosequencing of the LINE-1 promoter after bisulfite conversion. Data are shown for both embryonic day 13.5 (E13.5) and post-natal day 4 (PN4). (a) LUMA-Liver, (b) LUMA-Brain, (c) LUMA-Kidney, (d) LINE-Liver, (e) LINE-Brain and (f) LINE-Kidney. White bars show global methylation within the control group, gray bars from the NK-depleted group and the black bars from the DC expanded group. Data represent mean±S.D.-derived from 10 to 15 embryos/pups per group. Significant differences are noted as *P<0.05 and **P<0.01 according to ANOVA followed by Tukey post-hoc test

