Figure 3.
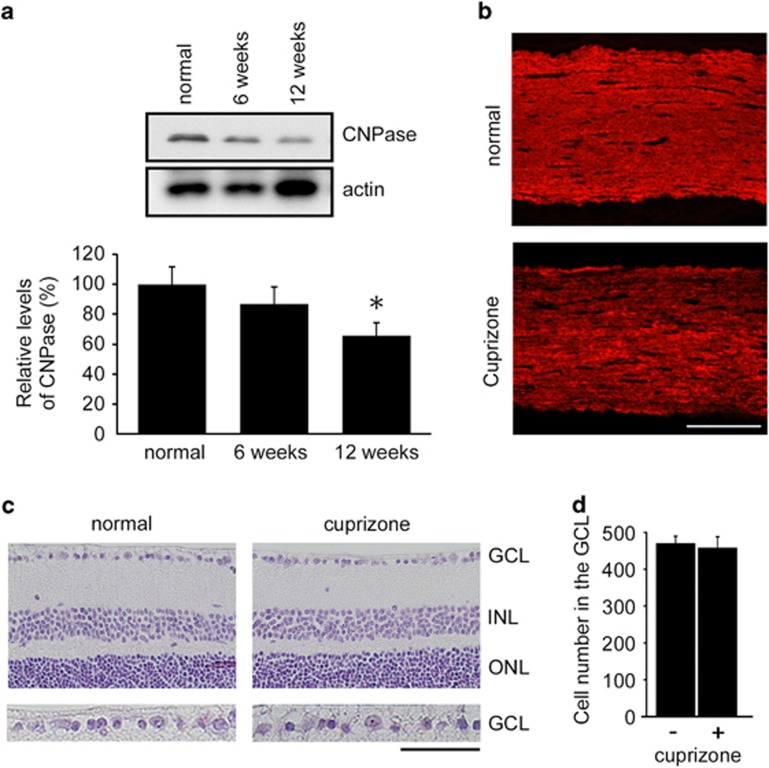
Effects of cuprizone on the retina and optic nerve degeneration. (a) Western blot analysis displaying decreased CNPase expression in the optic nerves after cuprizone treatment. The data are presented as mean±S.E.M. of six independent samples. The results are expressed as percentages of the normal WT mice. *P<0.05. (b) Optic nerve sections illustrating a decreased MBP intensity after cuprizone treatment for twelve weeks. Scale bar: 100 μm. (c) Hematoxylin and eosin staining of retinal sections after cuprizone treatment for twelve weeks. The microscopic image of each section within 0.5–1 mm from the optic disc was scanned. ganglion cell layer (GCL), ganglion cell layer; INL, inner nuclear layer; ONL, outer nuclear layer. Scale bar: 100 μm and 50 μm in the upper and lower panels, respectively. (d) Quantification of the retinal degeneration. The number of cells in the GCL was counted from one ora serrata through the optic nerve to the other ora serrata. The data are presented as mean±S.E.M. of six independent samples

