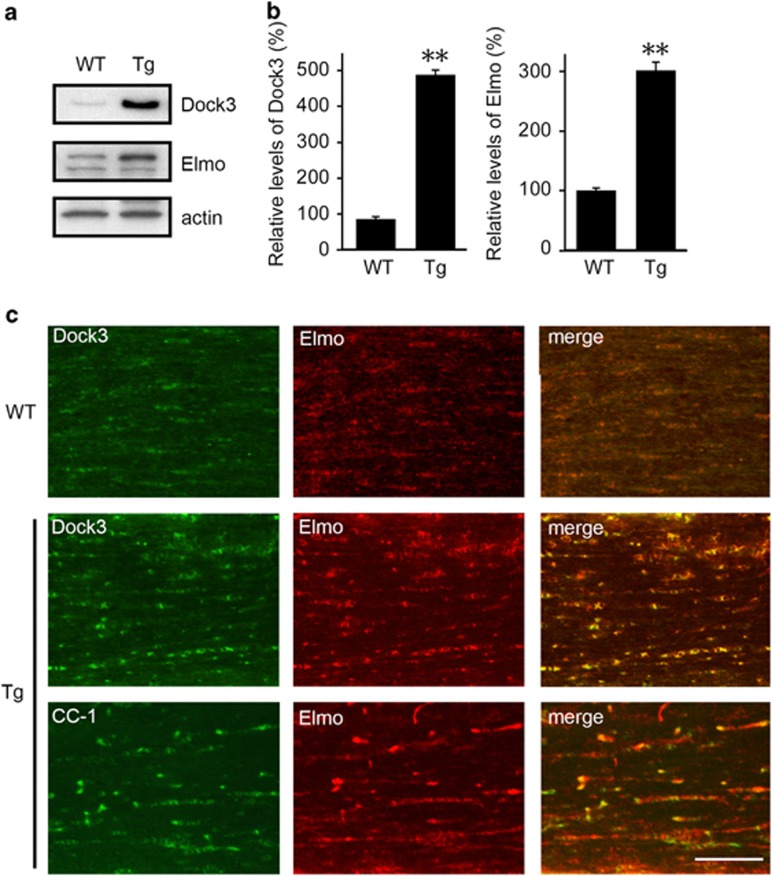
Figure 5.
Effects of Dock3 on Elmo expression in the optic nerves. (a) Western blot analysis of Dock3 and Elmo in the optic nerves of WT and Dock3 Tg mice. (b) Quantitative analysis of Dock3 and Elmo proteins in WT and Dock3 Tg mice. The data are presented as mean±S.E.M. of six independent samples. The results are expressed as percentages of the WT mice. **P<0.01. (c) Optic nerve sections illustrating a high intensity of Dock3 and Elmo in the optic nerve of Dock3 Tg mice compared with WT mice. Scale bar: 50 μm

