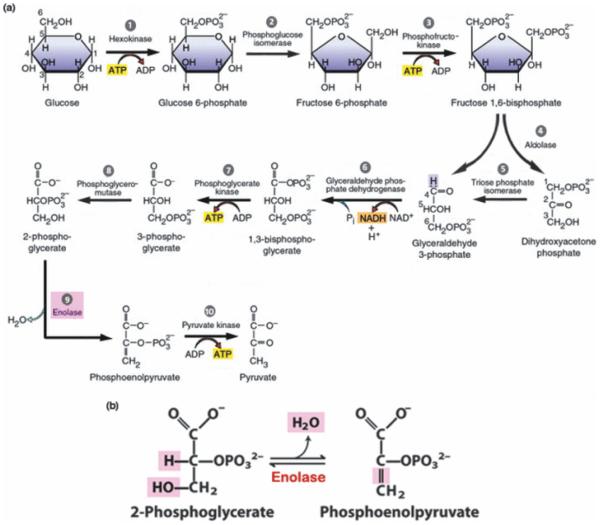
Figure 1.
a) Glycolysis. Schematic representation of aerobic glycolysis. Because two 3-carbon triose chains are produced from the reaction between aldolase and fructose-1,6-bisphosphate, steps 5-10 are completed twice (not shown). ATP production in steps 7 and 10 is thought to be the chief fuel-source for plasma membrane ion pumps, including the Na+/K+-ATPase and Ca2+-ATPase, rather than ATP produced by mitochondrial oxidative phosphorylation [adapted from (Karp 2003)]. b) Enolase reaction. Step 9 in the glycolytic chain involves conversion of 2-phosphoglycerate (2-PGA) to phosphoenolpyruvate (PEP) by enolase [adapted from (Nelson & Cox 2009)].

