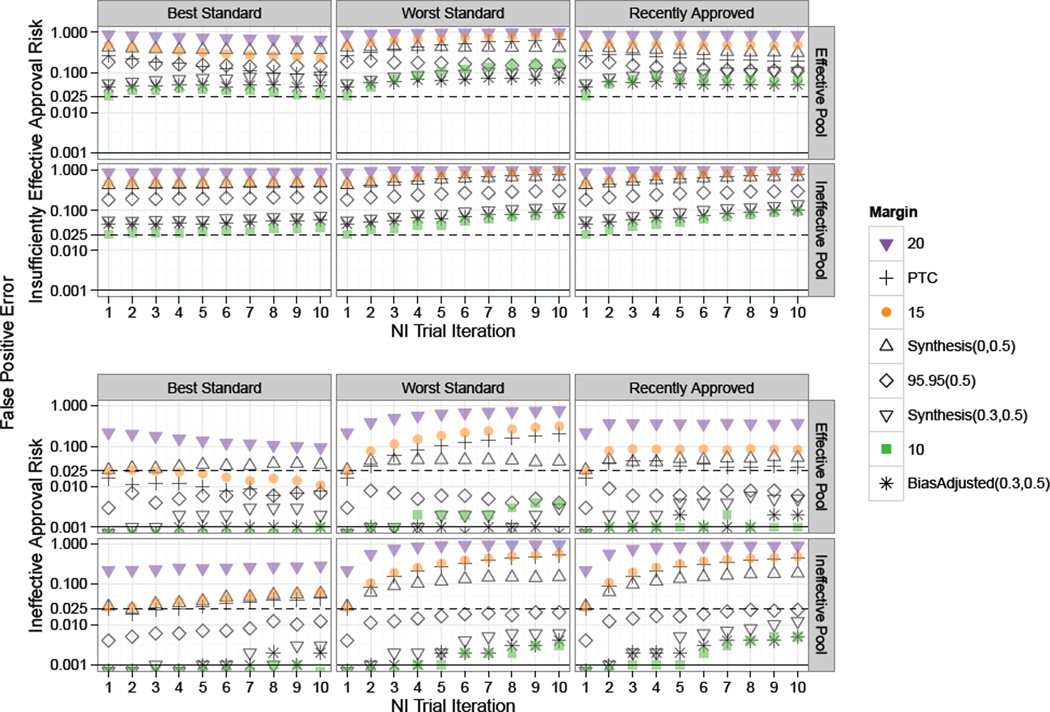
Figure 5.
Study 2 plot of risk of approval of “Insufficiently Effective” and “Ineffective” treatments under non-constancy due to imbalances in patient characteristics. Standard for each NI trial in a series of ten NI Trial Iterations was chosen according to one of the rules: “Best”, “Worst”, or “Recently Approved”. Success rates on experimental treatments were drawn from Scaled Beta distributions representing an “Effective Pool” or “Ineffective Pool” of therapies. Solid black and dashed horizontal lines indicate tolerance thresholds of 0.025 and 0.001 for “Insufficiently Effective” and “Ineffective” false positive error rates respectively. “Insufficiently Effective” False Positive Error risk is high across all scenarios, and “Ineffective” Error risk is inflated even using the Best treatment as Standard for 95–95 and larger margins.

