Abstract
Parkinson’s disease (PD) is the second most common neurodegenerative disorder with both mitochondrial dysfunction and insufficient autophagy playing a key role in its pathogenesis. Among the risk factors, exposure to the environmental neurotoxin rotenone increases the probability of developing PD. We previously reported that in differentiated SH-SY5Y cells, rotenone-induced cell death is directly related to inhibition of mitochondrial function. How rotenone at nM concentrations inhibits mitochondrial function, and whether it can engage the autophagy pathway necessary to remove damaged proteins and organelles, is unknown. We tested the hypothesis that autophagy plays a protective role against rotenone toxicity in primary neurons. We found that rotenone (10–100 nM) immediately inhibited cellular bioenergetics. Concentrations that decreased mitochondrial function at 2 hr, caused cell death at 24 hr with an LD50 of 10 nM. Overall autophagic flux was decreased by 10 nM rotenone at both 2 and 24 hr, but surprisingly mitophagy, or autophagy of the mitochondria, was increased at 24 hr, suggesting that a mitochondrial-specific lysosomal degradation pathway may be activated. Upregulation of autophagy by rapamycin protected against cell death while inhibition of autophagy by 3-methyladenine (3-MA) exacerbated cell death. Interestingly, while 3-MA exacerbated the rotenone-dependent effects on bioenergetics, rapamycin did not prevent rotenone-induced mitochondrial dysfunction, but caused reprogramming of mitochondrial substrate usage associated with both complex I and complex II activities. Taken together, these data demonstrate that autophagy can play a protective role in primary neuron survival in response to rotenone; moreover, surviving neurons exhibit bioenergetic adaptations to this metabolic stressor.
INTRODUCTION
Parkinson’s disease brains exhibit decreased complex I activity (1), which is important since this enzyme is both the rate-limiting step for mitochondrial respiratory chain activity, and a key site for generation of reactive oxygen species (2). Mitochondrial defects are widespread in both the substantia nigra and cortex in Parkinson’s disease (3;4), but the underlying mechanisms that lead to mitochondrial dysfunction are unclear. Meta-analyses of several studies indicated that pesticide exposure potentially increases Parkinson’s disease risk on average by ~1.5–3 fold (5–8). Also, a recent study reported that exposure to paraquat and rotenone in farming communities increased the incidence of Parkinson’s disease with an odds ratio of ~2–3 fold (9). Rotenone is an herbicide, insecticide and piscicide, and is the most potent member of the rotenoid family of neurotoxins found in tropical plants. Rotenone can pass through the blood brain barrier and plasma membrane, bind to complex I in striatal sections from rodent brains with a Kd of ~55 nM, decreasing its activity and inducing oxidative stress (10;11). In animal models, dopaminergic neurons appear to be particularly susceptible to rotenone-induced degeneration (12). Oral administration of rotenone at 30 mg/kg for 56 d in mice has been shown to cause α-synuclein accumulation and dopaminergic neurodegeneration (13). In vitro studies have shown that short term (1 week), low concentrations of rotenone induce accumulation of soluble and insoluble α-synuclein, and after 4 weeks, increased apoptosis in SK-N-MC neuroblastoma cells (14).
Autophagy plays an important role in mitochondrial quality control (15–28), and changes in autophagy have been observed in post mortem PD brains (29). In addition, some of the familial PD genes such as pink1, parkin and DJ-1 play important roles in the process of autophagy of mitochondria, known as mitophagy (30). In undifferentiated SH-SY5Y cells it has been shown that rotenone inhibits autophagic flux prior to inducing cell death, and that restoration of autophagic activity is partially protective (31;32). Importantly, this transformed cell line is metabolically distinct from neurons, and in the undifferentiated state exhibits aerobic glycolysis that likely changes their susceptibility to mitochondrial neurotoxins (33). Studies performed in primary cortical neurons have shown that concentrations of rotenone far in excess of that resulting in complete inhibition of complex I activity (e.g. 250 nM-1 μM) induce externalization of the mitochondrial-specific cardiolipin, which serves as a tag for the mitochondria to undergo mitophagy (34). How low nM concentrations of rotenone, which are more likely to occur during environmental exposure, affect mitochondrial function in primary neurons, and whether mitophagy is engaged as a protective response, have not been critically examined, and are the focus of the present study.
METHODS
Cell culture
Primary rat cortical neurons were isolated from embryonic day 18 rats purchased from Charles River Laboratory. All animal handling has been approved by University of Alabama at Birmingham IACUC. Briefly, 80,000 cells per well were plated in the XF24 plates for cell viability, western blotting, and mitochondrial function assays. 250,000 cells per well were plated for microscopy in 4-well chamber slides. Neurons were grown in neurobasal media with B27 supplement, L-glutamine, and Penn/Strep, with half of the media changed every 3 days.
Measurement of cellular bioenergetic function
To measure cellular bioenergetics in primary cortical neurons, the Seahorse Bioscience XF24 Extracellular Flux Analyzer (XF24) was used (33–37). Both the oxygen consumption rate (OCR) in pmol/min and the extracellular acidification rate (ECAR) in mpH/min were measured and normalized to total protein amount per each individual well, determined by the DC protein assay (BioRad).
Mitochondrial function in live neuronal cultures was assessed using the sequential injection of oligomycin, FCCP, and antimycin A, with concentrations optimized to be 1 μg/ml, 1 μM and 10 μM, respectively. Parameters of mitochondrial function were analyzed as described in our prior publications (35–37). Briefly, specific inhibitors are used in the “mitochondrial stress test” to characterize different bioenergetics parameters. The first inhibitor injected, after a stable baseline is established, is oligomycin which inhibits ATP synthase (mitochondrial complex V) and thus the portion of OCR that is inhibitable by oligomycin is termed ATP linked OCR (OCR before oligomycin injection minus OCR after oligomycin injection). The remaining OCR is largely due to proton transport back into the mitochondrial matrix via non mitochondrial complex V-mediated mechanisms, and is termed Proton leak OCR (OCR after oligomycin injection minus after antimycin A injection). Maximal OCR after uncoupling by FCCP represents the unconstrained activity of the mitochondrial electron transport chain that can be achieved with the cellular substrate supply. The reserve capacity is calculated by subtracting the basal OCR from the FCCP stimulated maximal OCR, and represents the bioenergetic function available for cellular energetics to combat cellular stress (37). Basal ECAR was determined at the time point before oligomycin addition, and maximal ECAR was determined at the time point after oligomycin addition. Rotenone was freshly prepared in DMSO and diluted into the medium. Co-treatment with rapamycin or 3-methyladenine for 24 hrs prior to the experiment was conducted prior to bioenergetics analysis in the XF24.
Mitochondrial complex I and complex II activity in permeabilized neuronal cultures was measured by injection with 20 μg/ml saponin plus substrates (ADP, pyruvate, malate, and succinate). Then rotenone (2 μM) was added to determine respiration due to complex I, followed by antimycin-A (10 μM) for non-mitochondrial OCR (38).
Cell Viability
Cell viability was measured by the trypan blue exclusion assay as described previously (36). 80,000 cells/well were plated on a XF24 plate. Cells were exposed to rotenone with or without rapamycin and 3MA for 24 hrs, after which cells were trypsinized and mixed with trypan blue before counting. Cells that excluded trypan blue were considered viable.
Confocal Microscopy
250,000 cells per well were plated on 4 well Lab-Tek chambered cover-glass slides previously coated with poly-L-lysine. On DIV7, cells were treated with rotenone for 24 hrs. Then cells were washed with phenol free media and incubated with 25 nM MitoTracker Red and 100 nM LysoTracker Green (sigma). After 30 min, cells were imaged using the Zeiss LSM 710 Confocal Microscope. Red and green pixel intensity overlay was determined using quantification software on the Nikon eclipse Microscope. n>20 cells per group.
Western Blot Analysis
80,000 cells per well were grown in XF24 plates and treated for 2 or 24 hrs with rotenone alone, rotenone + rapamycin, or rotenone + 3MA. Medium was removed and 20 μl of lysis buffer were added to each well. Samples were triturated in the wells, collected, and 5 μl of sample buffer was added. Protein extracts were separated by SDS-PAGE and probed with anti-LC3 and anti-actin antibodies (Sigma). Relative levels of protein were quantified using NIH Image J software and all samples were compared to a standard control on all gels.
Relative mtDNA copy number
DNA was extracted from primary neurons following treatment. Quantitative real-time PCR was performed by using a SYBR Green master mix (Life Tech Corp) in an ABI 7500. The primer sequences used for mtDNA were mtDNA-F (5′-CCAAGGAATTCCCCTACACA-3′) and mtDNA-R (5′-GAAATTGCGAGAATGGTGGT -3′). The primer sequences for the nuclear DNA were 18S-F (5′-CGAAAGCATTTGCCAAGAAT-3′) and 18S-R (5′-AGTCGGCATCGTTTATGGTC-3′) and targeted the human nuclear 18S DNA. Cycling conditions were as follows: 94°C for 15 s, followed by 40 cycles at 94°C for 15 s, 60°C for 1 min and 60°C for 1 min. The mtDNA copy number was normalized to the amplification of the 18S nuclear amplicon.
mtDNA damage assay
Mitochondrial DNA damage (mtDNA) was evaluated by modified quantitative PCR (QPCR) method as described previously (1). Briefly, total DNA was extracted and used as PCR sample. The primer sequences used for mtDNA long segment (16kb) were mtLongF (5′-GGA CAA ATA TCA TTC TGA GGA GCT - 3′) and mtLongR (5′-GGA TTA GTC AGC CGT AGT TTA CGT-3′). The primer sequences for mtDNA short (80bp) segment were mtShortF (5′-CCAAGGAATTCCCCTACACA-3′) and mtShortR (5′-GAAATTGCGAGAATGGTGGT -3′). The mtDNA long segment and the short segment were amplified using AccuPrime™ Taq DNA Polymerase High Fidelity kit (Life Tech Corp) and separated by agarose gel electrophoresis, respectively. mtDNA long PCR conditions were as follows: 94°C for 11 sec, followed by 25 cycles of denaturation at 94°C for 15 sec, annealing and extension at 67°C for 12 min, final extension at 72 °C for 10 min. mtDNA Short PCR conditions were as follows: 94°C for 6 sec, followed by 18 cycles of denaturation at 94°C for 20 sec, annealing and extension at 65°C for 1 min, and final extension at 72°C for 10 min. The gels were stained by ethidium bromide and visualized with Alpha Imager, and densitometry analysis performed using Image J software. Lesion frequency per 16 kb of mtDNA was calculated using the following equation (39).
Statistical analysis
Data are reported as mean ± SEM. Comparisons between two groups were performed with unpaired Student’s t-tests. A p value of less than 0.05 was considered statistically significant.
RESULTS
Effects of rotenone on cell viability and cellular bioenergetics function
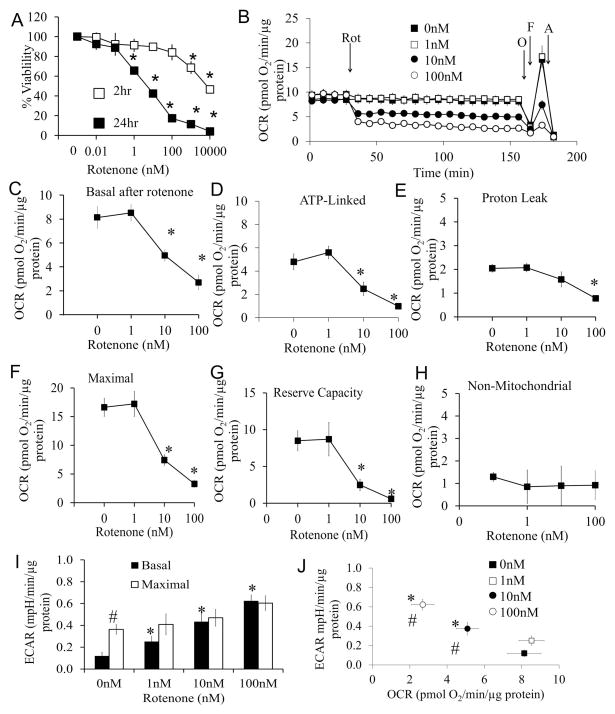
Primary cortical neurons (DIV7) were treated with increasing concentrations of rotenone for 2 and 24 hrs and cell viability assessed. Rotenone induced a concentration and time dependent cell death, after exposure for 24 hr (Figure 1A). To test if early mitochondrial dysfunction precedes cell death, cellular bioenergetics were measured. After four baseline measurements of oxygen consumption rate (OCR), rotenone (0 – 100 nM) was injected into the wells, and OCR measured over the next 2 hrs (Figure 1B) followed by a mitochondrial stress test (37) (Figure 1C–H).
Figure 1. Effects of rotenone on cell viability and mitochondrial function.
(A) Cell viability was assessed by trypan blue exclusion cell counts following exposure to rotenone for 2 and 24 hrs. Data are expressed as percent normalized to 0 nM rotenone. *p<0.05 compared to 0 nM. (B) Oxygen consumption rate (OCR) was assayed using the Seahorse XF analyzer. After 4 basal measurements, rotenone was injected at concentrations of 0, 1, 10, and 100 nM, and measurements were continued for 2 hrs, followed by sequential injection of oligomycin (O), FCCP (F), and antimycin A (A). Data was normalized to total protein per well. (C) Basal OCR at 2 hr after rotenone injection at concentrations of 0 nM, 1 nM, 10 nM, and 100 nM (i.e. the OCR before oligomycin). *p<0.05 compared to 0 nM. (D) ATP linked OCR (OCR before oligomycin injection minus after oligomycin injection). *p<0.05 compared to 0 nM. (E) Proton leak OCR (OCR after oligomycin injection minus after antimycin A injection). *p<0.05 compared to 0 nM. (F) Maximal OCR (OCR after FCCP injection). *p<0.05 compared to 0 nM. (G) Reserve capacity (OCR after FCCP injection minus before oligomycin injection). *p<0.05 compared to 0 nM. (H) Non-mitochondrial OCR (OCR after antimycin injection). (I) Basal ECAR (before oligomycin), and maximal ECAR (after oligomycin) were plotted in the bar graph. *p<0.05 compared to 0 nM. # p<0.05 compared to Basal ECAR. (J) Basal ECAR versus basal OCR at the time point 2 hrs after rotenone treatment and before oligomycin injection. *p<0.05 compared to 0 nM. # p<0.05 compared to 0nM ECAR. Data=mean±SEM, n=3. Student t-test.
Concentrations of rotenone as low as 10 nM caused an immediate decrease in the major parameters of mitochondrial function consistent with inhibition of functional electron transport at complex I (Figure 1B and C). These include a decrease in ATP-linked respiration (Figure 1D), as well as maximal OCR and reserve capacity (Figures 1F and G). There was no change in non-mitochondrial OCR (Figure 1H) following rotenone treatment at any concentration.
The extracellular acidification rate (ECAR), which represents changes in glycolytic flux, was also measured for 2 hrs after the injection of rotenone in the XF24. Immediately after the injection of 1, 10, or 100 nM rotenone, the glycolytic rate was increased compared to 0 nM and remained constant for 2 hr (basal ECAR, Figures 1I). Injection of mitochondrial complex V inhibitor oligomycin further increased ECAR in control cells as a result of inhibition of mitochondrial function and the expected compensatory unregulation of glycolysis to meet cellular energy demands (maximal ECAR, Figure 1I). At the concentrations of 1 –100 nM rotenone, oligomycin was unable to further stimulate glycolysis after ATP synthase inhibition (Figure 1I). After 2 hr rotenone exposure, there is the anticipated association between the decrease in basal OCR and an increase in basal ECAR with increasing concentrations of rotenone (Figure 1J).
Effects of rotenone on autophagic flux and mitophagy
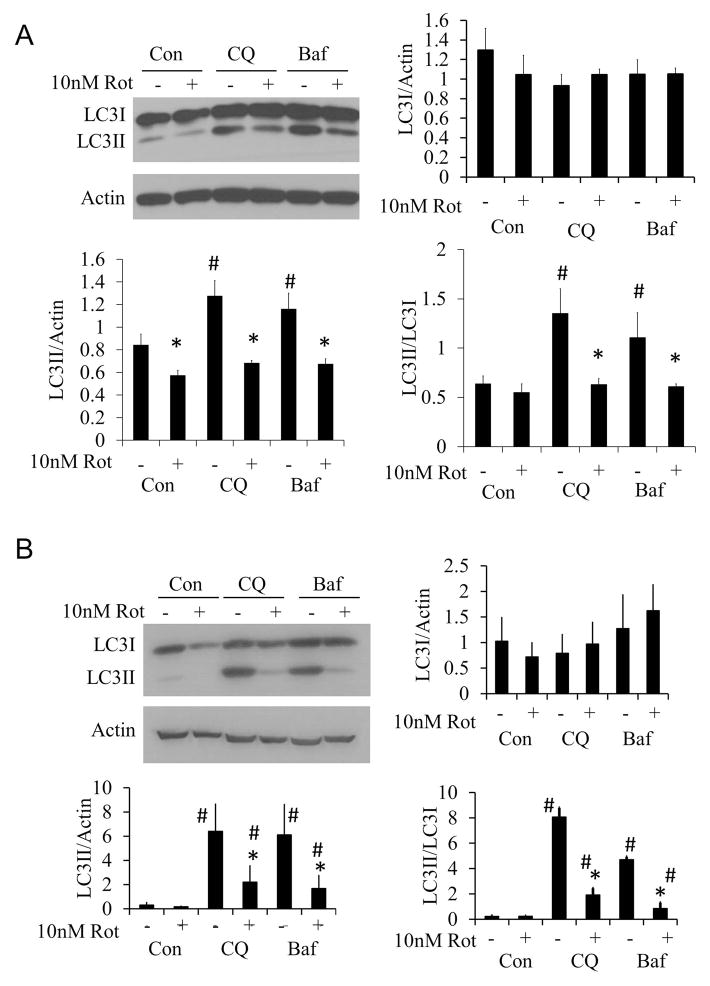
Autophagic flux was measured in response to 10 nM rotenone at both 2 and 24 hrs, by treating primary cortical neurons with rotenone in the presence or absence of chloroquine (CQ) or bafilomycin (Baf), both of which block autophagy completion (17;19;21–24). Western blot analysis for LC3 protein levels showed that 10 nM rotenone inhibited autophagy at both 2 (Figure 2A) and 24 hrs (Figure 2B).
Figure 2. Effects of 2 and 24 hr 10 nM rotenone treatment on autophagic flux.
(A) Western blot analysis of autophagy protein LC3 after 2 hr 10 nM rotenone treatment + 40 μM chloroquine (CQ) or 10 nM bafilomycin (Baf). (B) Western blot analysis of autophagy protein LC3 after 24 hr 10 nM rotenone treatment+40 μM chloroquine (CQ) or 10 nM bafilomycin (Baf). Data=mean±SEM, n=3. Student t-test, *p<0.05 compared to 0 nM rotenone. #p<0.05 compared to control.
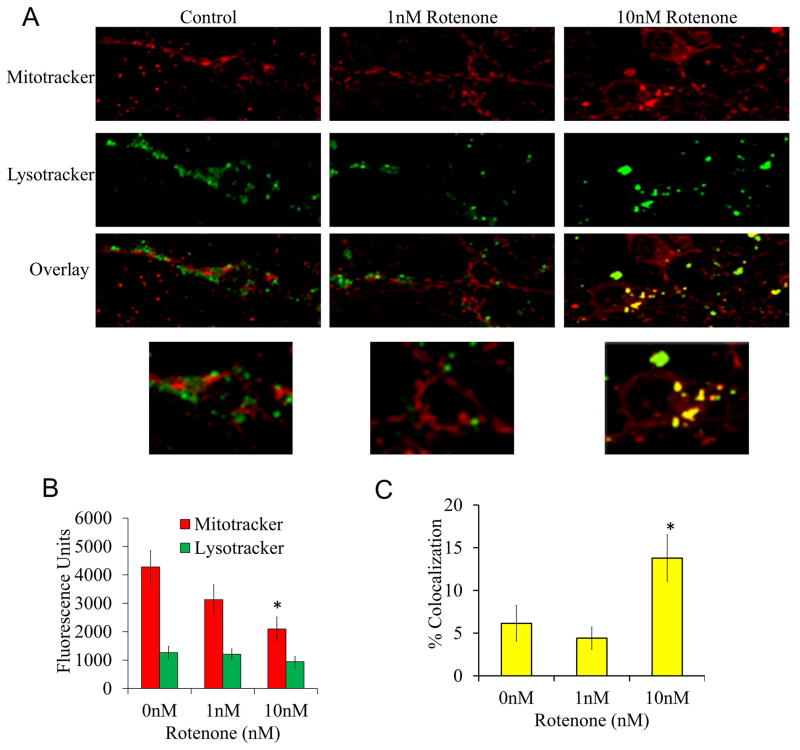
To determine if dysfunctional mitochondria are being cleared by mitophagy, cells were treated with 10 nM rotenone for 24 hrs and stained with MitoTracker and LysoTracker. We found that rotenone had a significant impact on MitoTracker fluorescence, but did not affect LysoTracker staining, which is consistent with partial suppression of the mitochondrial membrane potential (Figure 3). The increased co-localization of mitochondria with lysosomes is consistent with increased mitophagy in response to rotenone (Figure 3). Interestingly, the greatest extent of colocalization was seen in the soma and was absent in neuronal processes (Figure 3).
Figure 3. Mitophagy in response to 24 hr rotenone treatment.
Cells were treated with 0, 1 and 10 nM rotenone for 24 hrs then imaged in phenol free media loaded with MitoTracker and LysoTracker dye (50 nM and 125 nM respectively). (A) Representative images of cells treated with increasing doses of rotenone for 24 hrs loaded with MitoTracker and LysoTracker. (B) Fluorescence units of MitoTracker and LysoTracker for each group of cells. (C) Quantitation of colocalization of mitochondria with lysosomes. Data=mean±SEM, n>20 cells per group. *p<0.05, Student t-test compared to 0 nM treatment.
Effects of rapamycin and 3MA on autophagy and cell viability in response to rotenone exposure
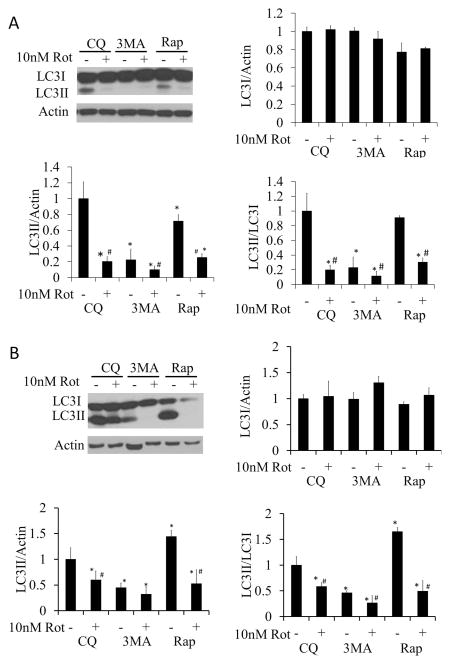
Autophagic flux analysis was performed by measuring LC3II/LC3I ratio in the presence and absence of 40 μM chloroquine (CQ). A 2 hr exposure of rotenone (10 nM), alone or in combination with rapamycin (1μM), decreased autophagy (Figure 4A). At the 24 hr time point, rotenone alone still decreased autophagy. In contrast, rapamycin significantly increased autophagy above basal levels, and this was substantially inhibited by rotenone (Figure 4B). The inhibitor of autophagy, 3MA (10 mM), significantly decreased the LC3II/LC3I ratio compared to CQ treated cells, indicating a decrease in autophagy in the absence or presence of rotenone (Figure 4B).
Figure 4. Changes in autophagic flux following 2 or 24 hr treatment with 10 nM rotenone in the presence or absence of rapamycin or 3MA.
All flux assays were performed in the presence of 40 μM CQ. (A) Western blot analysis of autophagy protein LC3 following 10 nM rotenone treatment ± 1 μM rapamycin, or treatment ± 10 mM 3MA for 2 hr. (B) Western blot analysis of autophagy protein LC3 following 10 nM rotenone treatment ± 1 μM rapamycin or treatment ± 10 mM 3MA for 24 hr. Student t-test, *p<0.05 compared to CQ treatment without rotenone, 3MA or rapamycin, #p<0.05 compared to same treatment without rotenone.
To assess the impact on viability, primary cortical neurons were co-treated with rotenone +/− rapamycin, or rotenone +/− 3MA for 2 or 24 hrs. At the 2 hr time point, neither of the modulators of autophagy showed a biologically significant impact on viability, suggesting that the effects on bioenergetics are an early response, and autophagy is engated later. In contrast, at the 24 hr time point, rapamycin modestly enhanced cell viability at rotenone concentrations of 1 – 100 nM, while 3MA exacerbated cell death at 0.1 – 100 nM rotenone (Figure 5).
Figure 5. Effects of increasing doses of rotenone ± rapamycin or 3MA on cell viability at 24 hrs.
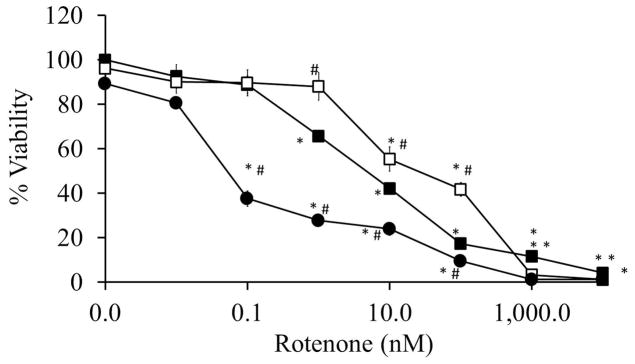
Cell viability was assayed following 24 hr treatment with increasing doses of rotenone ± rapamycin or 3MA. Data=mean±SEM, n=3. Student t-test, *p<0.05 compared to 0 nM group, #p<0.05 compared to same concentration of rotenone.
Effects of rapamycin and 3MA on mitochondrial function
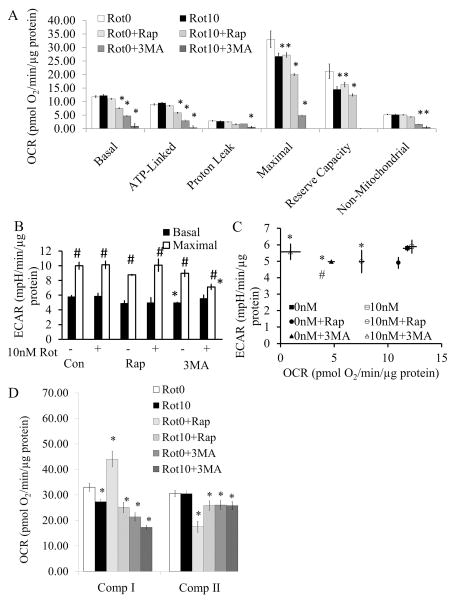
In primary cortical neuronal cultures, 10 nM rotenone exposure for 24 hrs resulted in decreased maximal and reserve capacity OCR in the remaining viable cells, but with no significant effect on basal mitochondrial respiration, suggesting some recovery of bioenergetic function (Figure 6A). Interestingly, exposure to rapamycin alone for 24 hrs had similar effects on maximal and reserve capacity OCR compared to 10 nM rotenone, suggesting an off-target effect on mitochondrial function. Co-treatment of rapamycin with rotenone resulted in a further decrease in basal, ATP-linked, maximal and reserve capacity OCR. The most striking effect was with 3-MA alone or in combination with rotenone, which additively decreased basal, ATP-linked, maximal and reserve capacity OCR (Figure 6A). There were only subtle differences among the 6 groups regarding ECAR. 3MA exposure led to a slight decrease in basal ECAR, and 3MA + rotenone decreased maximal ECAR (Figure 6B–C). To further assess the impact on mitochondrial function, permeabilization of these cultured neurons after 24 hr rotenone exposure and/or co-treatment with rapamycin or 3MA was performed, followed by complex I and complex II activity assays. Interestingly, at 24 hr, complex I inhibition was modest with rotenone alone even though the basal OCR after rotenone in intact cells is comparable to control. Surprisingly, rapamycin increased complex I activity but inhibited complex II suggesting a reprogramming of mitochondrial substrate usage associated with treatment (Figure 6D). Cells exposed to a co-treatment of rapamycin and rotenone exhibited similar complex I activity to that of rotenone alone with partial restoration of complex II activity. 3-MA decreased both complex I and complex II activities, with an additive effect on complex I with rotenone treatment (Figure 6D). mtDNA copy number and damage are not significantly different among the 6 treatment groups (Supplementary Figure 1).
Figure 6. Mitochondrial function after exposure to 0 or 10 nM rotenone ± rapamycin or 3-MA for 24 hr.
Cells were treated with 0 or 10 nM rotenone ± rapamycin or 3MA for 24 hrs. (A) Basal mitochondrial function was then assayed for 30 min, followed by oligomycin, FCCP, and antimycin A injection to calculate Basal, ATP linked, Proton leak, Maximal, Reserve capacity, and Non-mitochondrial OCR. *p<0.05 compared to 0 nM rotenone (Rot0). (B) Basal ECAR was measured for 30 min, followed by oligomycin injection to stimulate maximal ECAR. *p<0.05 compared to 0 nM rotenone (-Rot). #p<0.05 compared to Basal ECAR. (C) Basal ECAR versus basal OCR. *p<0.05 compared to basal OCR 0 nM rotenone. #p<0.05 compared to basal ECAR 0 nM rotenone. (D) Complex I and II activities were assessed by injection of 20 μg/ml saponin, together with ADP and complex I and II substrates, Pyruvate (Pyr), Malate (Mal), and Succinate (Succ). Then complex I activity was specifically inhibited by the injection of rotenone (2 μM), followed by the complex III inhibitor antimycin A at 10 μM. The rotenone inhibitable oxygen consumption rate (OCR) is attributable to complex I activity, the antimycin A inhibitable OCR is attributable to complex II activity (38). Data=mean±SEM, n=3–6. Student t-test, *p<0.05 compared to 0 nM rotenone (Rot0).
DISCUSSION
In this study, we investigated changes to mitochondrial function in response to the environmental neurotoxin rotenone in primary neurons, and the impact of modulating autophagy on neuronal survival in response to this compound.
As expected, rotenone has a significant effect on mitochondrial function consistent with inhibition at complex I (Figure 1 and 6). Of particular note is the sensitivity of the key aspects of cellular mitochondrial function at only 10 nM rotenone. These data highlight a critical role of complex I in maintaining the bioenergetics of primary neurons, and an inability of other metabolic substrates to compensate. It is important to note that in a cellular setting, inhibition of complex I will also inhibit flux through the TCA cycle, increasing the impact of rotenone inhibition on mitochondrial electron transport. Autophagic flux was inhibited by rotenone (Figure 2), suggesting that the cells could also exhibit deficits in removal of damaged cellular constituents. In contrast, despite the fact that autophagy is inhibited, rotenone only decreased MitoTracker fluorescence without affecting LysoTracker staining (Figure 3). This might be due to partial inhibition of mitochondrial function rather than a decrease in mitochondrial mass, since there was no apparent change in mtDNA copy number (Supplementary Figure 1).
Associated with the decrease in mitochondrial membrane potential, MitoTracker and LysoTracker colocalization studies (Figure 3) demonstrated that 10 nM rotenone for 24 hrs increased the delivery of mitochondria to the lysosomes, indicating an increase in mitophagy. The observation that rotenone induces mitophagy while general autophagic flux is inhibited suggests that a mitochondrial-specific lysosomal degradation pathway may be activated, as has recently been suggested, via formation of mitochondrial spheroids (40–42). Potential signaling mechanisms include, but are not limited to, preferential inhibitory modification of general macroautophagy but not mitophagy proteins, or preferential fission/fusion machinery activities and PARKIN/PINK1 function in response to loss of mitochondrial membrane potential. Increasing mitophagy without changing mtDNA copy number may be due to the following possibilities: 1) at 24 hr after rotenone, although the mitophagic events are increased, mtDNA has not been digested at this time point, 2) there is concurrent mitochondrial biogenesis that maintains the mitochondrial population, or 3) the population of mitochondria that colocalizes with lysosomes are mainly mitochondrial fragments that are devoid of mtDNA.
The clearance of damaged mitochondria may improve the quality of the mitochondrial population, and so protect the primary cortical neurons from rotenone toxicity. These data are supported by the finding that inhibition of autophagy exacerbated rotenone toxicity whereas activation of autophagy was partially protective (Figure 5). Since we observed that in the presence of rotenone, rapamycin no longer activates autophagic flux, the partially protective effect of rapamycin may be independent of general macroautophagy, but may be dependent on mitophagy. In addition, rapamycin inhibits protein translation by inhibition of MTOR, thereby decreasing the levels of short-lived proteins without significantly changing long-lived proteins; this may lead to changes in cellular signaling pathways. In our study, rapamycin enhanced complex I activity and decreased complex II activity on its own. In the presence of 10 nM rotenone, rapamycin did not change complex I activity, but further decreased complex II activity. Whether the decreased complex II activity contributed to rapamycin’s ability to partially protect rotenone toxicity is unclear. To conclusively determine this possibility would require specific means to selectively upregulate complex II activity to restore them to control levels in the presence of rapamycin. Removal of damaged mitochondria may also contribute to the protective function of rapamycin. However, since the mtDNA damage assay did not reveal any significant differences between rotenone exposed cells and rotenone + rapamycin exposed cells, more extensive studies using mitochondrial proteomic and lipidomic analysis are needed.
The interpretation of the bioenergetic profiles in responses to 3-MA and rapamycin are complicated, since both these compounds had an effect on cellular mitochondrial function and complex I and II activities in the absence of rotenone. Cellular mitochondrial parameters were most severely affected with the combination of both rotenone and 3-MA, which also incidentally exhibited the greatest toxicity (Figure 5). This finding is consistent with the primary hypothesis that the prevention of autophagy is detrimental to cellular bioenergetics and viability in the presence of rotenone. Interestingly, the approximately 90% inhibition of basal respiration in the presence of both 3-MA and rotenone is greater than the additive effect of rotenone or 3-MA alone, thus suggesting that inhibition of autophagy can accelerate bioenergetic defects. The rapamycin data are more difficult to explain, since the increase in viability (Figure 5) was not reflected by an obvious improvement in cellular bioenergetics (Figure 6). It is likely that the bioenergetic function in the presence of rapamycin and rotenone is adequate to maintain cell viability. Taken together, these observations indicate that general autophagy and mitophagy are differentially regulated in neurons, and that enhancement of general autophagy by rapamycin may result in metabolic modulation of the surviving cells.
Supplementary Material
Acknowledgments
We thank members of the Zhang and the Darley-Usmar laboratories for discussions and technical help. This work was supported by NIHR01-NS064090 and a VA merit award (to JZ).
Footnotes
- if ‘none’, insert “The authors have no conflict of interest to declare.”
- otherwise insert info unless it is already included
Reference List
- 1.Schapira AH, Gegg M. Mitochondrial contribution to Parkinson’s disease pathogenesis. Parkinsons Dis. 2011;2011:159160. doi: 10.4061/2011/159160. [DOI] [PMC free article] [PubMed] [Google Scholar]
- 2.Murphy MP. How mitochondria produce reactive oxygen species. Biochem J. 2009;417:1–13. doi: 10.1042/BJ20081386. [DOI] [PMC free article] [PubMed] [Google Scholar]
- 3.Parker WD, Jr, Parks JK, Swerdlow RH. Complex I deficiency in Parkinson’s disease frontal cortex. Brain Res. 2008;1189:215–218. doi: 10.1016/j.brainres.2007.10.061. [DOI] [PMC free article] [PubMed] [Google Scholar]
- 4.Keeney PM, Xie J, Capaldi RA, Bennett JP., Jr Parkinson’s disease brain mitochondrial complex I has oxidatively damaged subunits and is functionally impaired and misassembled. J Neurosci. 2006;26:5256–5264. doi: 10.1523/JNEUROSCI.0984-06.2006. [DOI] [PMC free article] [PubMed] [Google Scholar]
- 5.Priyadarshi A, Khuder SA, Schaub EA, Priyadarshi SS. Environmental risk factors and Parkinson’s disease: a metaanalysis. Environ Res. 2001;86:122–127. doi: 10.1006/enrs.2001.4264. [DOI] [PubMed] [Google Scholar]
- 6.Priyadarshi A, Khuder SA, Schaub EA, Shrivastava S. A meta-analysis of Parkinson’s disease and exposure to pesticides. Neurotoxicology. 2000;21:435–440. [PubMed] [Google Scholar]
- 7.van der MM, Brouwer M, Kromhout H, Nijssen P, Huss A, Vermeulen R. Is pesticide use related to Parkinson disease? Some clues to heterogeneity in study results. Environ Health Perspect. 2012;120:340–347. doi: 10.1289/ehp.1103881. [DOI] [PMC free article] [PubMed] [Google Scholar]
- 8.Pezzoli G, Cereda E. Exposure to pesticides or solvents and risk of Parkinson disease. Neurology. 2013;80:2035–2041. doi: 10.1212/WNL.0b013e318294b3c8. [DOI] [PubMed] [Google Scholar]
- 9.Tanner CM, Kamel F, Ross GW, Hoppin JA, Goldman SM, Korell M, Marras C, Bhudhikanok GS, Kasten M, Chade AR, et al. Rotenone, paraquat, and Parkinson’s disease. Environ Health Perspect. 2011;119:866–872. doi: 10.1289/ehp.1002839. [DOI] [PMC free article] [PubMed] [Google Scholar]
- 10.Higgins DS, Jr, Greenamyre JT. [3H]dihydrorotenone binding to NADH: ubiquinone reductase (complex I) of the electron transport chain: an autoradiographic study. J Neurosci. 1996;16:3807–3816. doi: 10.1523/JNEUROSCI.16-12-03807.1996. [DOI] [PMC free article] [PubMed] [Google Scholar]
- 11.Panov A, Dikalov S, Shalbuyeva N, Taylor G, Sherer T, Greenamyre JT. Rotenone model of Parkinson disease: multiple brain mitochondria dysfunctions after short term systemic rotenone intoxication. J Biol Chem. 2005;280:42026–42035. doi: 10.1074/jbc.M508628200. [DOI] [PubMed] [Google Scholar]
- 12.Betarbet R, Sherer TB, MacKenzie G, Garcia-Osuna M, Panov AV, Greenamyre JT. Chronic systemic pesticide exposure reproduces features of Parkinson’s disease. Nat Neurosci. 2000;3:1301–1306. doi: 10.1038/81834. [DOI] [PubMed] [Google Scholar]
- 13.Inden M, Kitamura Y, Abe M, Tamaki A, Takata K, Taniguchi T. Parkinsonian rotenone mouse model: reevaluation of long-term administration of rotenone in C57BL/6 mice. Biol Pharm Bull. 2011;34:92–96. doi: 10.1248/bpb.34.92. [DOI] [PubMed] [Google Scholar]
- 14.Sherer TB, Betarbet R, Stout AK, Lund S, Baptista M, Panov AV, Cookson MR, Greenamyre JT. An in vitro model of Parkinson’s disease: linking mitochondrial impairment to altered alpha-synuclein metabolism and oxidative damage. J Neurosci. 2002;22:7006–7015. doi: 10.1523/JNEUROSCI.22-16-07006.2002. [DOI] [PMC free article] [PubMed] [Google Scholar]
- 15.Giordano S, Darley-Usmar V, Zhang J. Autophagy as an essential cellular antioxidant pathway in neurodegenerative disease. Redox Biol. 2014;2:82–90. doi: 10.1016/j.redox.2013.12.013. [DOI] [PMC free article] [PubMed] [Google Scholar]
- 16.Levonen AL, Hill BG, Kansanen E, Zhang J, Darley-Usmar VM. Redox regulation of antioxidants, autophagy, and the response to stress: Implications for electrophile therapeutics. Free Radic Biol Med. 2014;71C:196–207. doi: 10.1016/j.freeradbiomed.2014.03.025. [DOI] [PMC free article] [PubMed] [Google Scholar]
- 17.Boyer-Guittaut M, Poillet L, Liang Q, Bole-Richard E, Ouyang X, Benavides GA, Chakrama FZ, Fraichard A, Darley-Usmar VM, Despouy G, et al. The role of GABARAPL1/GEC1 in autophagic flux and mitochondrial quality control in MDA-MB-436 breast cancer cells. Autophagy. 2014;10:986–1003. doi: 10.4161/auto.28390. [DOI] [PMC free article] [PubMed] [Google Scholar]
- 18.Mitchell T, Chacko B, Ballinger SW, Bailey SM, Zhang J, Darley-Usmar V. Convergent mechanisms for dysregulation of mitochondrial quality control in metabolic disease: implications for mitochondrial therapeutics. Biochem Soc Trans. 2013;41:127–133. doi: 10.1042/BST20120231. [DOI] [PMC free article] [PubMed] [Google Scholar]
- 19.Mitchell T, Johnson MS, Ouyang X, Chacko BK, Mitra K, Lei X, Gai Y, Moore DR, Barnes S, Zhang J, et al. Dysfunctional mitochondrial bioenergetics and oxidative stress in Akita+/Ins2-derived beta-cells. Am J Physiol Endocrinol Metab. 2013;305:E585–E599. doi: 10.1152/ajpendo.00093.2013. [DOI] [PMC free article] [PubMed] [Google Scholar]
- 20.Dodson M, Darley-Usmar V, Zhang J. Cellular metabolic and autophagic pathways: traffic control by redox signaling. Free Radic Biol Med. 2013;63:207–221. doi: 10.1016/j.freeradbiomed.2013.05.014. [DOI] [PMC free article] [PubMed] [Google Scholar]
- 21.Benavides GA, Liang Q, Dodson M, Darley-Usmar V, Zhang J. Inhibition of autophagy and glycolysis by nitric oxide during hypoxia-reoxygenation impairs cellular bioenergetics and promotes cell death in primary neurons. Free Radic Biol Med. 2013;65:1215–1228. doi: 10.1016/j.freeradbiomed.2013.09.006. [DOI] [PMC free article] [PubMed] [Google Scholar]
- 22.Liang Q, Benavides GA, Vassilopoulos A, Gius D, Darley-Usmar V, Zhang J. Bioenergetic and autophagic control by Sirt3 in response to nutrient deprivation in mouse embryonic fibroblasts. Biochem J. 2013;454:249–257. doi: 10.1042/BJ20130414. [DOI] [PMC free article] [PubMed] [Google Scholar]
- 23.Dodson M, Liang Q, Johnson MS, Redmann M, Fineberg N, Darley-Usmar VM, Zhang J. Inhibition of glycolysis attenuates 4-hydroxynonenal-dependent autophagy and exacerbates apoptosis in differentiated SH-SY5Y neuroblastoma cells. Autophagy. 2013;9:1996–2008. doi: 10.4161/auto.26094. [DOI] [PMC free article] [PubMed] [Google Scholar]
- 24.Higdon AN, Benavides GA, Chacko BK, Ouyang X, Johnson MS, Landar A, Zhang J, Darley-Usmar VM. Hemin causes mitochondrial dysfunction in endothelial cells through promoting lipid peroxidation: the protective role of autophagy. Am J Physiol Heart Circ Physiol. 2012;302:H1394–H1409. doi: 10.1152/ajpheart.00584.2011. [DOI] [PMC free article] [PubMed] [Google Scholar]
- 25.Hill BG, Benavides GA, Lancaster JR, Jr, Ballinger S, Dell’italia L, Zhang J, Darley-Usmar VM. Integration of cellular bioenergetics with mitochondrial quality control and autophagy. Biol Chem. 2012;393:1485–1512. doi: 10.1515/hsz-2012-0198. [DOI] [PMC free article] [PubMed] [Google Scholar]
- 26.Lee J, Giordano S, Zhang J. Autophagy, mitochondria and oxidative stress: cross-talk and redox signalling. Biochem J. 2012;441:523–540. doi: 10.1042/BJ20111451. [DOI] [PMC free article] [PubMed] [Google Scholar]
- 27.Zhang J. Autophagy and Mitophagy in Cellular Damage Control. Redox Biol. 2013;1:19–23. doi: 10.1016/j.redox.2012.11.008. [DOI] [PMC free article] [PubMed] [Google Scholar]
- 28.Redmann M, Dodson M, Boyer-Guittaut M, rley-Usmar V, Zhang J. Mitophagy mechanisms and role in human diseases. Int J Biochem Cell Biol. 2014;53C:127–133. doi: 10.1016/j.biocel.2014.05.010. [DOI] [PMC free article] [PubMed] [Google Scholar]
- 29.Anglade P, Vyas S, Javoy-Agid F, Herrero MT, Michel PP, Marquez J, Mouatt-Prigent A, Ruberg M, Hirsch EC, Agid Y. Apoptosis and autophagy in nigral neurons of patients with Parkinson’s disease. Histol Histopathol. 1997;12:25–31. [PubMed] [Google Scholar]
- 30.Youle RJ, Narendra DP. Mechanisms of mitophagy. Nat Rev Mol Cell Biol. 2011;12:9–14. doi: 10.1038/nrm3028. [DOI] [PMC free article] [PubMed] [Google Scholar]
- 31.Pan T, Rawal P, Wu Y, Xie W, Jankovic J, Le W. Rapamycin protects against rotenone-induced apoptosis through autophagy induction. Neuroscience. 2009;164:541–551. doi: 10.1016/j.neuroscience.2009.08.014. [DOI] [PubMed] [Google Scholar]
- 32.Xiong N, Jia M, Chen C, Xiong J, Zhang Z, Huang J, Hou L, Yang H, Cao X, Liang Z, et al. Potential autophagy enhancers attenuate rotenone-induced toxicity in SH-SY5Y. Neuroscience. 2011;199:292–302. doi: 10.1016/j.neuroscience.2011.10.031. [DOI] [PubMed] [Google Scholar]
- 33.Schneider L, Giordano S, Zelickson BR, Johnson S, Benavides A, Ouyang X, Fineberg N, Darley-Usmar VM, Zhang J. Differentiation of SH-SY5Y cells to a neuronal phenotype changes cellular bioenergetics and the response to oxidative stress. Free Radic Biol Med. 2011;51:2007–2017. doi: 10.1016/j.freeradbiomed.2011.08.030. [DOI] [PMC free article] [PubMed] [Google Scholar]
- 34.Chu CT, Ji J, Dagda RK, Jiang JF, Tyurina YY, Kapralov AA, Tyurin VA, Yanamala N, Shrivastava IH, Mohammadyani D, et al. Cardiolipin externalization to the outer mitochondrial membrane acts as an elimination signal for mitophagy in neuronal cells. Nat Cell Biol. 2013;15:1197–1205. doi: 10.1038/ncb2837. [DOI] [PMC free article] [PubMed] [Google Scholar]
- 35.Chacko BK, Kramer PA, Ravi S, Johnson MS, Hardy RW, Ballinger SW, Darley-Usmar VM. Methods for defining distinct bioenergetic profiles in platelets, lymphocytes, monocytes, and neutrophils, and the oxidative burst from human blood. Lab Invest. 2013;93:690–700. doi: 10.1038/labinvest.2013.53. [DOI] [PMC free article] [PubMed] [Google Scholar]
- 36.Giordano S, Lee J, Darley-Usmar VM, Zhang J. Distinct Effects of Rotenone, 1-methyl-4-phenylpyridinium and 6-hydroxydopamine on Cellular Bioenergetics and Cell Death. PLoS ONE. 2012;7:e44610. doi: 10.1371/journal.pone.0044610. [DOI] [PMC free article] [PubMed] [Google Scholar]
- 37.Dranka BP, Benavides GA, Diers AR, Giordano S, Zelickson BR, Reily C, Zou L, Chatham JC, Hill BG, Zhang J, et al. Assessing bioenergetic function in response to oxidative stress by metabolic profiling. Free Radic Biol Med. 2011;51:1621–1635. doi: 10.1016/j.freeradbiomed.2011.08.005. [DOI] [PMC free article] [PubMed] [Google Scholar]
- 38.Salabei JK, Gibb AA, Hill BG. Comprehensive measurement of respiratory activity in permeabilized cells using extracellular flux analysis. Nat Protoc. 2014;9:421–438. doi: 10.1038/nprot.2014.018. [DOI] [PMC free article] [PubMed] [Google Scholar]
- 39.Knight-Lozano CA, Young CG, Burow DL, Hu ZY, Uyeminami D, Pinkerton KE, Ischiropoulos H, Ballinger SW. Cigarette smoke exposure and hypercholesterolemia increase mitochondrial damage in cardiovascular tissues. Circulation. 2002;105:849–854. doi: 10.1161/hc0702.103977. [DOI] [PubMed] [Google Scholar]
- 40.Yin XM, Ding WX. The reciprocal roles of PARK2 and mitofusins in mitophagy and mitochondrial spheroid formation. Autophagy. 2013;9:1687–1692. doi: 10.4161/auto.24871. [DOI] [PubMed] [Google Scholar]
- 41.Ding WX, Li M, Biazik JM, Morgan DG, Guo F, Ni HM, Goheen M, Eskelinen EL, Yin XM. Electron microscopic analysis of a spherical mitochondrial structure. J Biol Chem. 2012;287:42373–42378. doi: 10.1074/jbc.M112.413674. [DOI] [PMC free article] [PubMed] [Google Scholar]
- 42.Ni HM, Williams JA, Jaeschke H, Ding WX. Zonated induction of autophagy and mitochondrial spheroids limits acetaminophen-induced necrosis in the liver. Redox Biol. 2013;1:427–432. doi: 10.1016/j.redox.2013.08.005. [DOI] [PMC free article] [PubMed] [Google Scholar]
Associated Data
This section collects any data citations, data availability statements, or supplementary materials included in this article.


