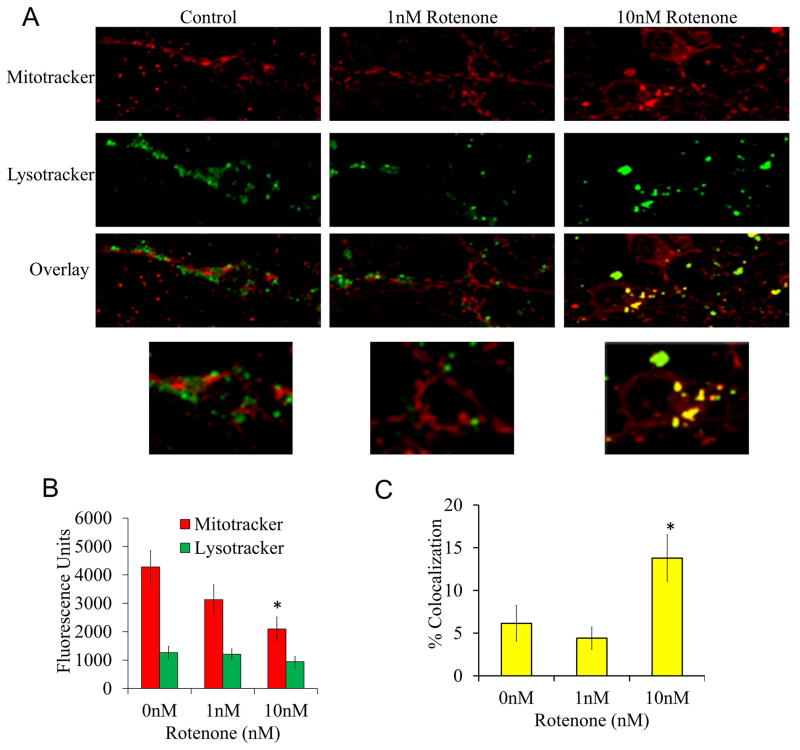
Figure 3. Mitophagy in response to 24 hr rotenone treatment.
Cells were treated with 0, 1 and 10 nM rotenone for 24 hrs then imaged in phenol free media loaded with MitoTracker and LysoTracker dye (50 nM and 125 nM respectively). (A) Representative images of cells treated with increasing doses of rotenone for 24 hrs loaded with MitoTracker and LysoTracker. (B) Fluorescence units of MitoTracker and LysoTracker for each group of cells. (C) Quantitation of colocalization of mitochondria with lysosomes. Data=mean±SEM, n>20 cells per group. *p<0.05, Student t-test compared to 0 nM treatment.

