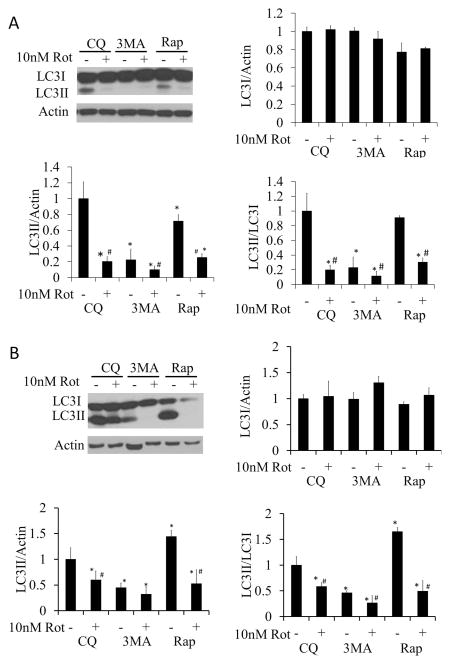
Figure 4. Changes in autophagic flux following 2 or 24 hr treatment with 10 nM rotenone in the presence or absence of rapamycin or 3MA.
All flux assays were performed in the presence of 40 μM CQ. (A) Western blot analysis of autophagy protein LC3 following 10 nM rotenone treatment ± 1 μM rapamycin, or treatment ± 10 mM 3MA for 2 hr. (B) Western blot analysis of autophagy protein LC3 following 10 nM rotenone treatment ± 1 μM rapamycin or treatment ± 10 mM 3MA for 24 hr. Student t-test, *p<0.05 compared to CQ treatment without rotenone, 3MA or rapamycin, #p<0.05 compared to same treatment without rotenone.

