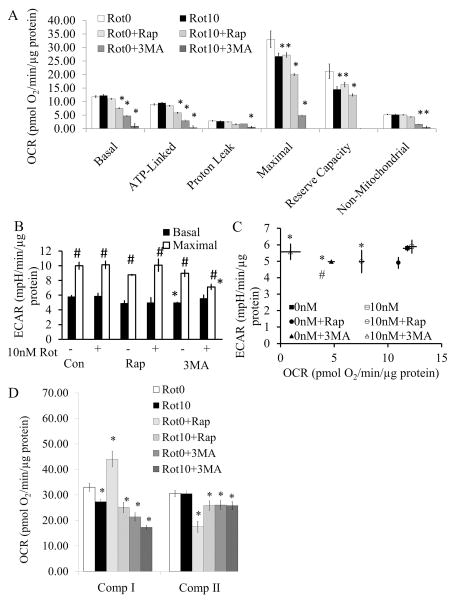
Figure 6. Mitochondrial function after exposure to 0 or 10 nM rotenone ± rapamycin or 3-MA for 24 hr.
Cells were treated with 0 or 10 nM rotenone ± rapamycin or 3MA for 24 hrs. (A) Basal mitochondrial function was then assayed for 30 min, followed by oligomycin, FCCP, and antimycin A injection to calculate Basal, ATP linked, Proton leak, Maximal, Reserve capacity, and Non-mitochondrial OCR. *p<0.05 compared to 0 nM rotenone (Rot0). (B) Basal ECAR was measured for 30 min, followed by oligomycin injection to stimulate maximal ECAR. *p<0.05 compared to 0 nM rotenone (-Rot). #p<0.05 compared to Basal ECAR. (C) Basal ECAR versus basal OCR. *p<0.05 compared to basal OCR 0 nM rotenone. #p<0.05 compared to basal ECAR 0 nM rotenone. (D) Complex I and II activities were assessed by injection of 20 μg/ml saponin, together with ADP and complex I and II substrates, Pyruvate (Pyr), Malate (Mal), and Succinate (Succ). Then complex I activity was specifically inhibited by the injection of rotenone (2 μM), followed by the complex III inhibitor antimycin A at 10 μM. The rotenone inhibitable oxygen consumption rate (OCR) is attributable to complex I activity, the antimycin A inhibitable OCR is attributable to complex II activity (38). Data=mean±SEM, n=3–6. Student t-test, *p<0.05 compared to 0 nM rotenone (Rot0).

