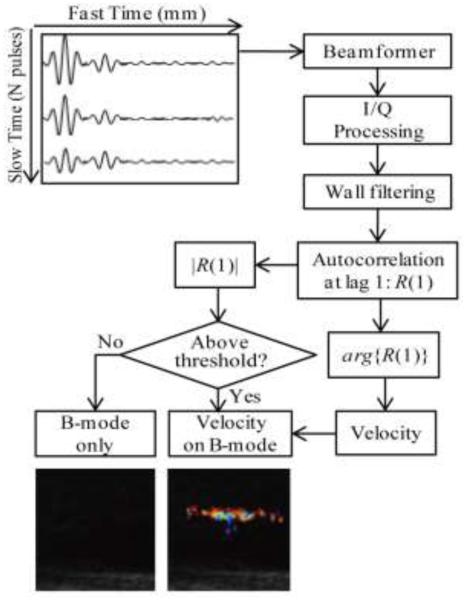
Fig. 4.
Flow diagram of Doppler signal processing employed in this study. Each of the twelve received pulses of the Doppler ensemble were first beamformed and then Hilbert transformed to obtain in-phase and quadrature components (IQ). They were then wall filtered along slow time to remove slow motions. For the color Doppler case, wall filtering is performed with a linear regression filter. For the pulse inversion case, wall filtering is performed with an additional low pass filtering at a cutoff frequency of PRF/4 so that only the signal associated with nonlinear scattering processes is retained. After wall filtering, the autocorrelation function of the complex signal along slow time at a lag of one Doppler pulse, R(1), was computed at each depth, i.e., for each fast time sample. If the amplitude of the autocorrelation function, |R(1)|, was lower than a threshold of 6 dB above the background noise level, the B-mode image was displayed in corresponding pixels. If |R(1)| was higher than the threshold, the corresponding pixels displayed color, which was determined by the phase of R(1). Arg{R(1)} corresponds to the derivative of the autocorrelation phase along slow time and can be converted to the velocity of moving scatterers.

