
Fig. 6.
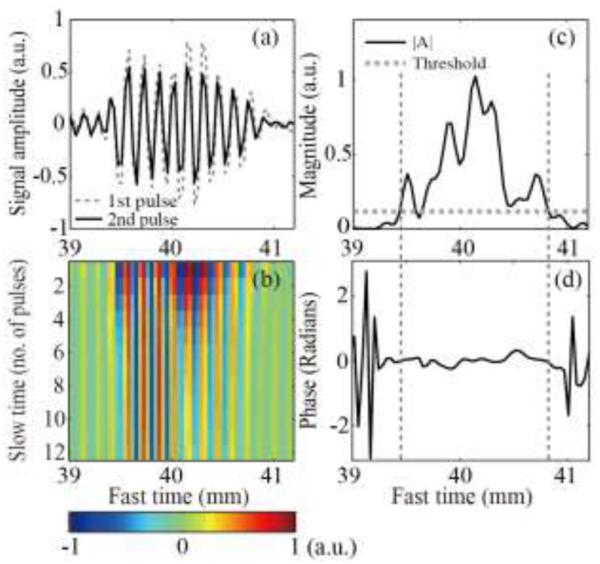
(a) Examples of the first two RF signals of the color Doppler ensemble received by the middle element of the imaging array, from the depth corresponding to the HIFU focus. The second pulse (solid line) had lower amplitude than the first (dashed line), but no phase shift. (b) All 12 received RF signals from the Doppler ensemble plotted along fast time (distance from the array element) and slow time (pulse number). The amplitude of the signals declined gradually across slow time, but the waveform remained unchanged and was not shifted in time. This suggested the presence of a stationary scatterer with declining reflectance, e.g. a shrinking bubble. (c) The magnitude and (d) the phase of the autocorrelation function at lag 1, calculated using the entire Doppler ensemble and plotted along fast time. The phase change was close to zero over the fast time segment (vertical dashed lines) in which the autocorrelation function amplitude exceeded the threshold (horizontal dashed line). Therefore, in the ultrasound image this region was displayed in color, corresponding to a very slowly moving scatterer (dark blue and red).