
Fig. 7.
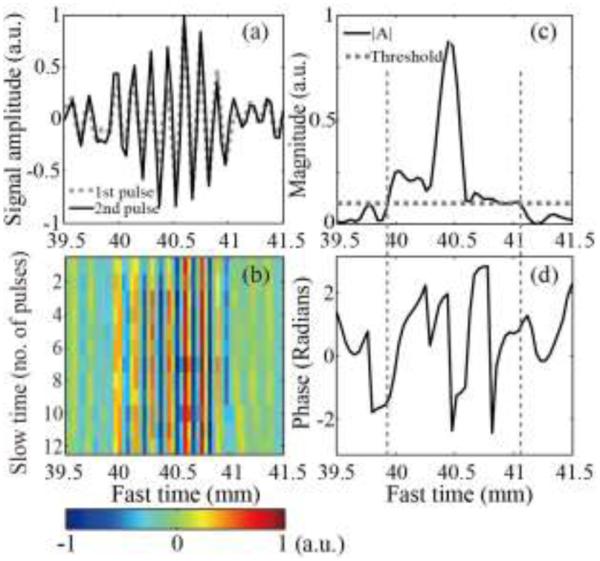
(a) Examples of the first two RF signals of the interleaving Doppler ensemble received by the middle element of the imaging array, from the depth corresponding to the HIFU focus. The overall level of the first pulse (dashed line) was similar to that of the second pulse (solid line), but there were substantial differences between the two signals: noticeable temporal shift and relative fluctuations. (b) All 12 received RF signals from the Doppler ensemble plotted along fast time (distance from the array element) and slow time (pulse number). The signal amplitude changed sporadically across slow time. (c) The amplitude and (d) phase of the autocorrelation function at lag 1, calculated using the entire Doppler ensemble and plotted along fast time. The range of autocorrelation magnitude (vertical dashed lines) which was higher than the threshold (horizontal dashed line) corresponded to a randomly changing phase over a wide range, which produced the color mosaic in the Doppler image.