
Fig. 8.
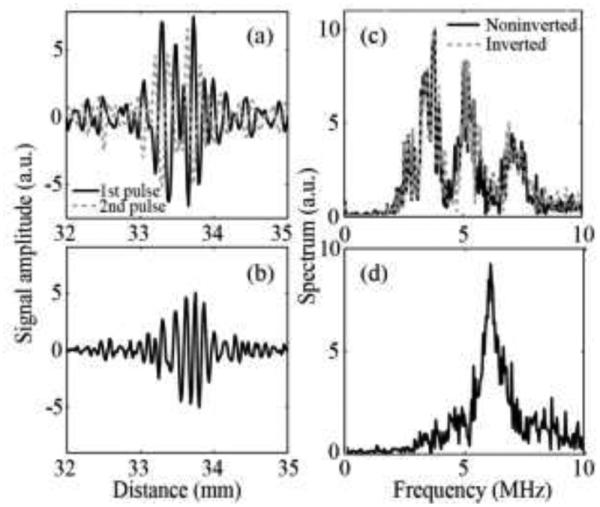
(a) An example of two consecutive RF signals from the pulse inversion Doppler ensemble received by the middle element of the array. The carrier frequency of the imaging pulses was set to 3 MHz. (b) The signal resulting from summation of the two received signals is shown in (a). (c) The frequency spectrum corresponding to the received signals and (d) summed signal in the range of 0-10MHz. After the signals were summed, only the second harmonic at 6 MHz was left in the spectrum.