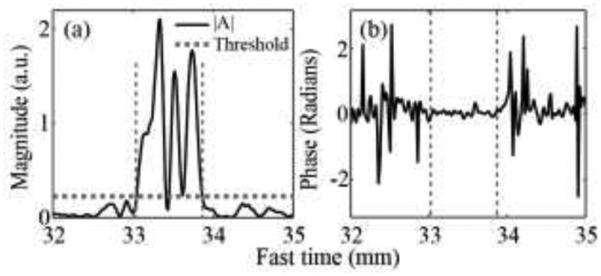
Fig. 9.

(a) The amplitude and (b) phase of autocorrelation function at lag 1 calculated using the entire pulse inversion Doppler ensemble, plotted along fast time. Similar to the color Doppler case, the phase was close to zero at the fast time segment (vertical dashed lines) that corresponded to the autocorrelation amplitude exceeding threshold (horizontal dashed line).
