
Fig. 3.
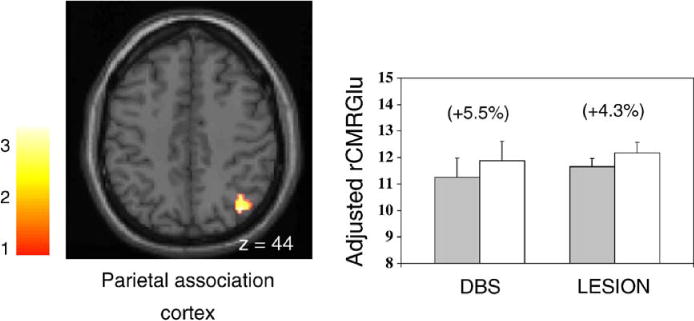
Left: regions with metabolic increases occurring in both STN stimulation and lesioning groups (see Table 3 and Fig. 2). Metabolic increases with treatment were detected in the parietal association cortex. [SPM{t}maps were superimposed on a single-subject MRI brain template; surgically treated hemisphere appears on the right.] Right: bar histograms illustrate rates of glucose utilization for the significant cluster in the posterior parietal cortex. Metabolic values (mean±SE) are presented for each treatment condition. The treatment-induced increase in parietal metabolism was greater in magnitude in the DBS group (P < 0.05). [OFF/PRE (filled bars) and ON/POST (open bars) correspond to the stimulation (DBS) and lesioning (LESION) groups, respectively. Regional changes with intervention appear in parenthesis.]