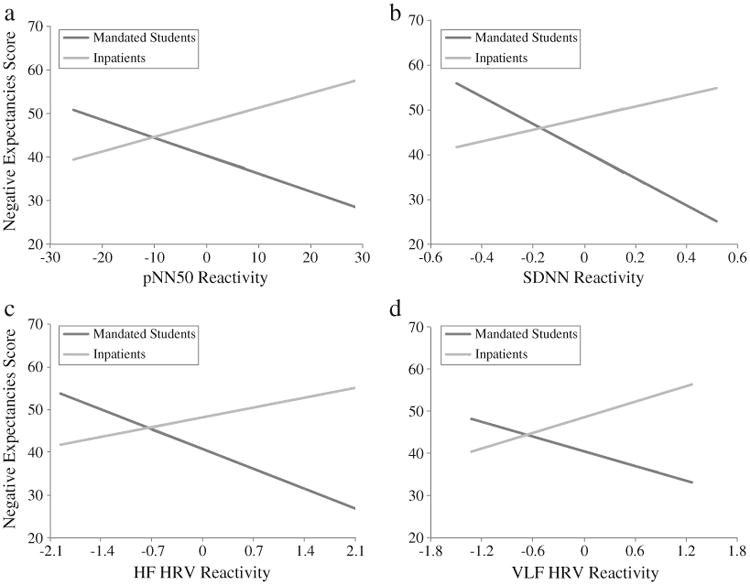
Fig. 1.

The relationship between negative alcohol expectancies and (a) pNN50 (b=.39, t(62)=2.80, ΔR2=.10, p<.01; SD=10.6), (b) SDNN (b=.58, t(62)=3.27, ΔR2=.14, p<.01; SD=0.2), (c) HF HRV (b=.45, t(62)=2.38, ΔR2=.08, p<05; SD=0.7), and (d) VLF HRV (b=.41, t(62)=2.60, ΔR2=.09, p<05; SD=0.6) cue reactivity in the inpatient and mandated student samples. Each graph (x-axis) shows unstandardized HRV residual scores (i.e., HRV reactivity) in the range of three standard deviations above and below the group mean. Reactivity scores above zero on the x-axis (right side of zero) indicate increased HRV levels compared to baseline HRV levels, whereas reactivity scores below zero on the x-axis (left side of zero) indicate reduced HRV levels.
