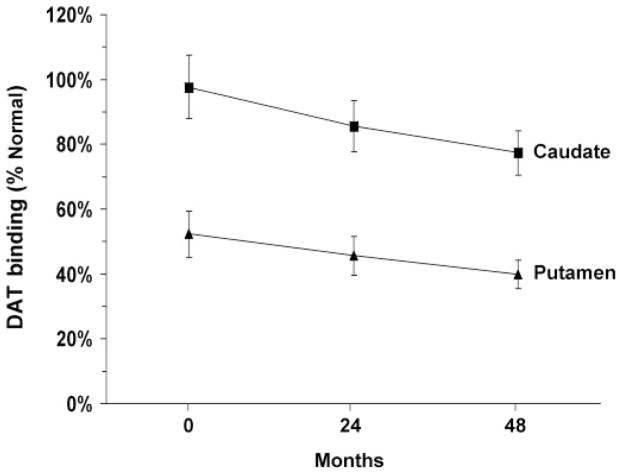
Fig. 3.
Mean striatal DAT binding at baseline, 24 and 48 months. Values for the caudate (squares) and putamen (triangles) are represented as percent of the normal mean value for each region (see text). In both regions, DAT binding declined linearly over time (P<0.003; RMANOVA). [Bars represent the standard error at each timepoint.]

