
Fig. 4.
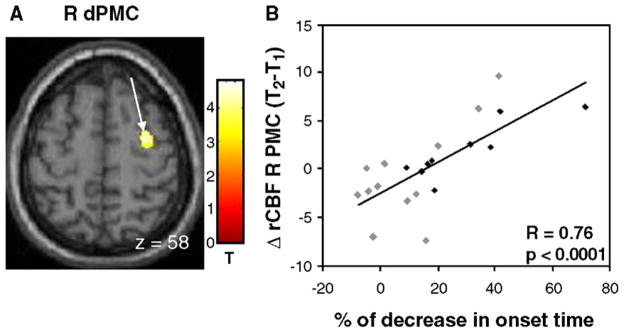
Relationship between progressive slowing in movement initiation and longitudinal changes in motor activation. (A) A significant correlation between these variables was identified in the right dorsal premotor cortex (dPMC) [the color stripe represents T values thresholded at 3.23; p<0.001, uncorrected]. (B) Scatterplot of individual subject rCBF values extracted from the cluster displayed in panel A (arrow; gray diamonds=R-Hemi; black diamonds=L-Hemi; see text). A significant correlation was present between worsening OT measures at follow-up and increasing activation within the right dPMC.