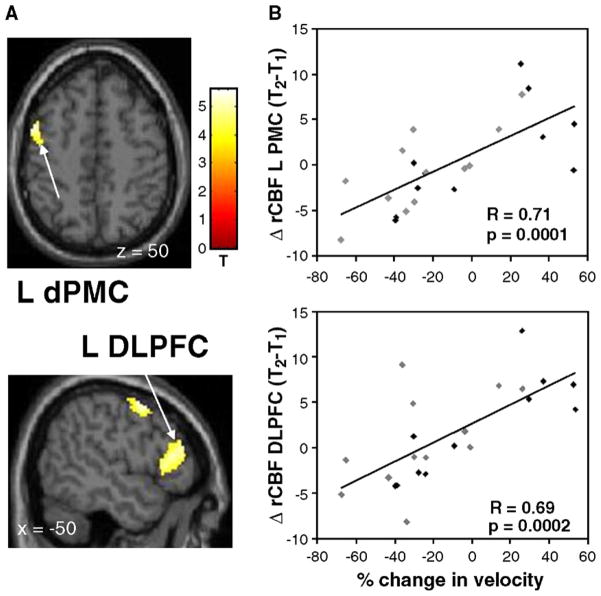
Fig. 5.
Relationship between changes in movement velocity and longitudinal changes in motor activation (positive values indicate increases in speed and negative values indicating movement slowing). (A) Significant correlations between these variables were identified in the left premotor cortex (dPMC; top) and in the dorsolateral prefrontal cortex (DLPFC; bottom) [the color stripe represents T values thresholded at 3.23; p<0.001, uncorrected]. (B) Scatterplots of individual subject rCBF values extracted from the clusters displayed in panel A (arrows; gray diamonds=R-Hemi; black diamonds=L-Hemi; see text). Significant correlations were present between the reduction in mean velocity at follow-up and declining activation within the left dPMC and DLPFC.

