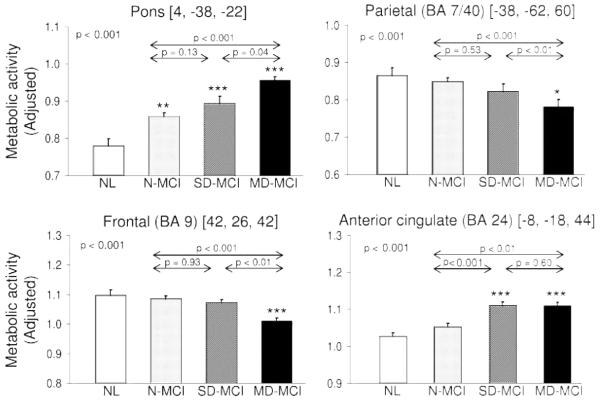
Figure 2.
Plots of means, standard errors, and significances of the metabolic rates with 4 mm sphere centered on the significant peaks acquired from voxel-based statistical parametric mapping analysis in multiple domain mild cognitive impairment (MCI), single domain MCI, without mild cognitive impairment, and 15 age-matched controls
*Represents the significance of each group compared to the controls. *p < 0.05, **p <= 0.005, ***p < 0.001.

