
Figure 5.
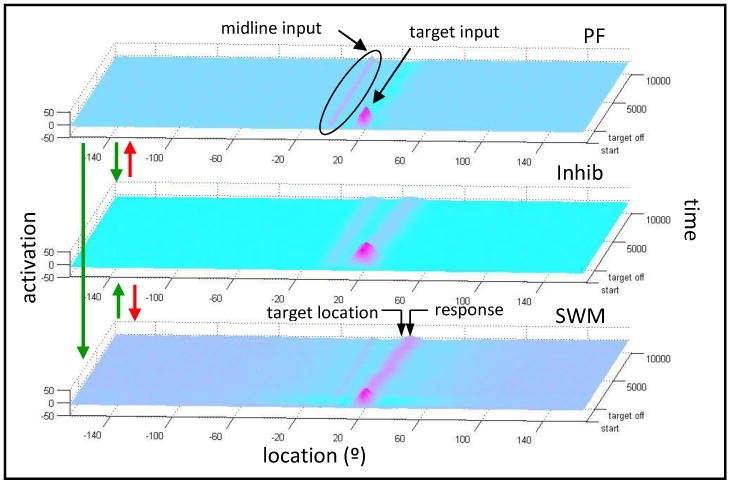
Simulation of the 3-layer DNF model. Panels represent: perceptual field [PF]; inhibitory field [Inhib]; working memory field [SWM]. Arrows show connections between fields. Green arrows represent excitatory connections and red arrows represent inhibitory connections. In each field, location is represented along the x-axis (with midline at location 0), activation along the y-axis, and time along the z-axis. The trial begins at the front of the figure and moves toward the back. See text for additional details.