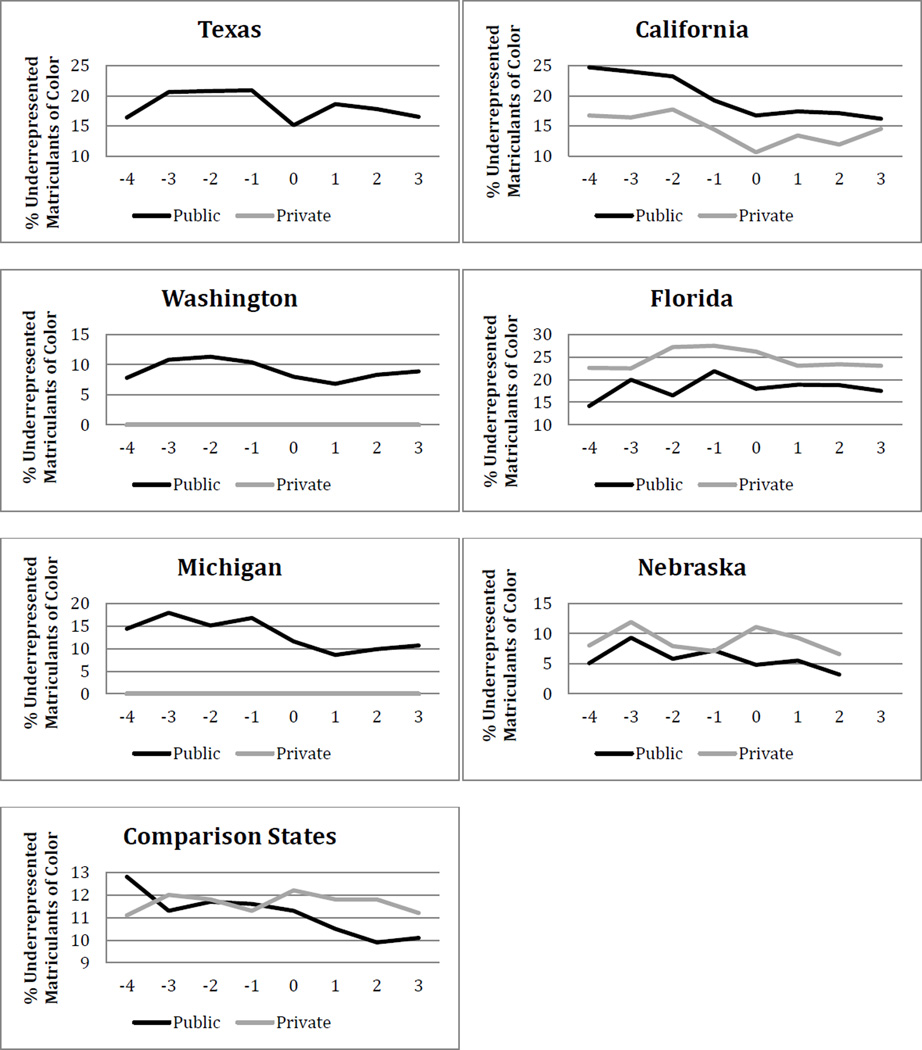
Figure 1.
Raw percent of first-time matriculated underrepresented students of color in each of the six states included in our sample with an affirmative action ban and the average percent of first-time matriculated underrepresented students of color in each of the 32 states selected as the comparison group, for the years of investigation in the study, for public and private institutions.

