Figure 1.
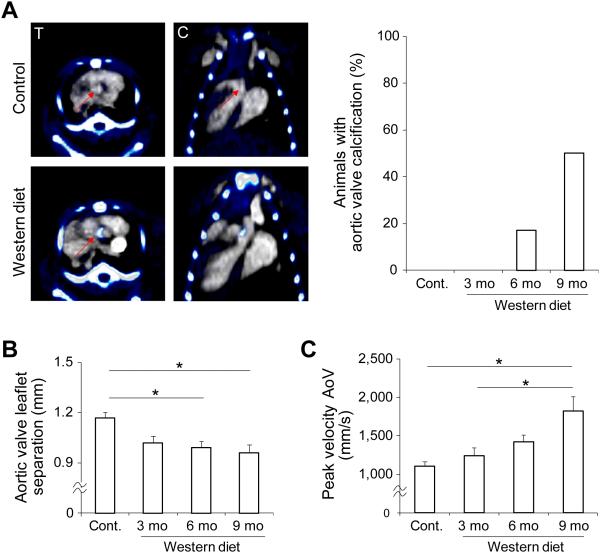
CAVD development in apoE−/− mice. A) Representative examples of fused non-contrast (pseudo-colored) and contrast-enhanced CT images of a control (left panel, top row) and an apoE−/− mouse fed on Western diet for 6 months (left panel, bottom row) demonstrating aortic valve calcification in the high fat fed animal; and percent of animals with CT-detectable aortic valve calcification (right panel). Arrow: aortic valve area, T: transverse, C: coronal, n=7, 6, 23, and 16 for control, 3 months, 6 months, and 9 months WD, respectively. B) Quantification of M mode echocardiography-derived systolic aortic valve leaflet separation. *p<0.05, n=14-23 in each group. C) Echo Doppler-derived peak systolic flow velocity across aortic valve (AoV) *p<0.05, n=14-23 in each group. mo: months.

