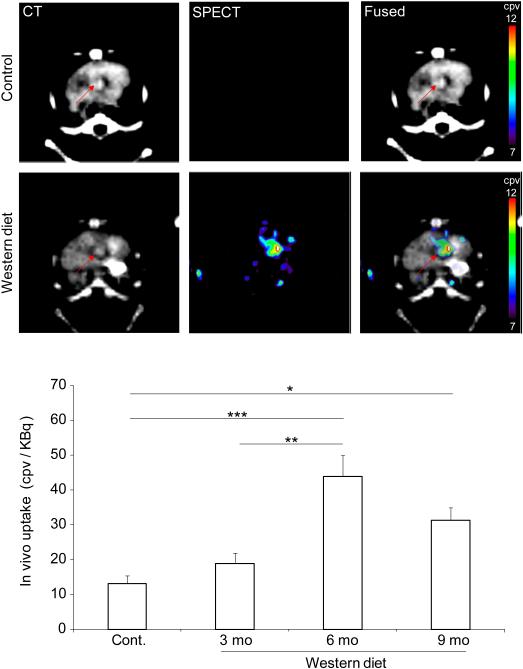
Figure 3.
In vivo imaging of MMP activation in CAVD. Examples of in vivo CT angiography, RP805 microSPECT, and fused transverse images in a control (top panel, top row) and an apoE−/− mouse fed on Western diet for 6 months (top panel, bottom row); and background-corrected quantification of RP805 uptake in CAVD (bottom panel). Arrows point to aortic valve area. cpv: counts per voxel. mo: months. n = 7-13 in each group, *p < 0.05, **p < 0.01, ***p < 0.0001.

