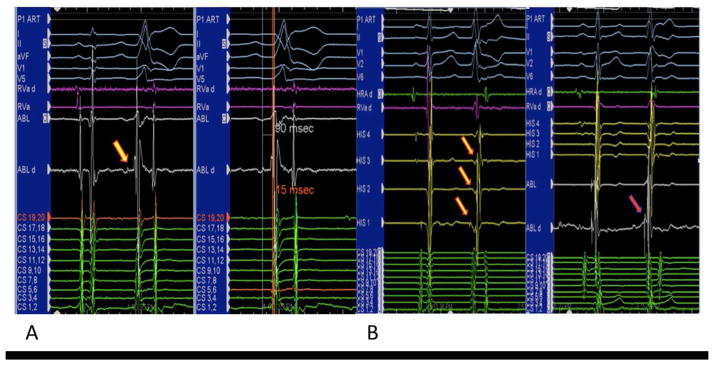
Figure 1.

Panel A – Intracardiac recording showing a PP, as indicated by the yellow arrow. The prepotential was noted preceding the local VEGM and surface QRS during spontaneous ectopy, with the PP-QRS being 90 ms and VEGM-QRS being 15 ms.
Panel B – A premature ventricular complex with relatively narrow QRS was associated with negative V-H interval and distal to proximal activation sequence of the His bundle as shown by the yellow arrows. At the ablation site, PP, which is indicated by the red arrow, was found ahead of the VEGM and the onset of the surface QRS.
PP – prepotential; VEGM – ventricular electrogram
