
Figure 1.
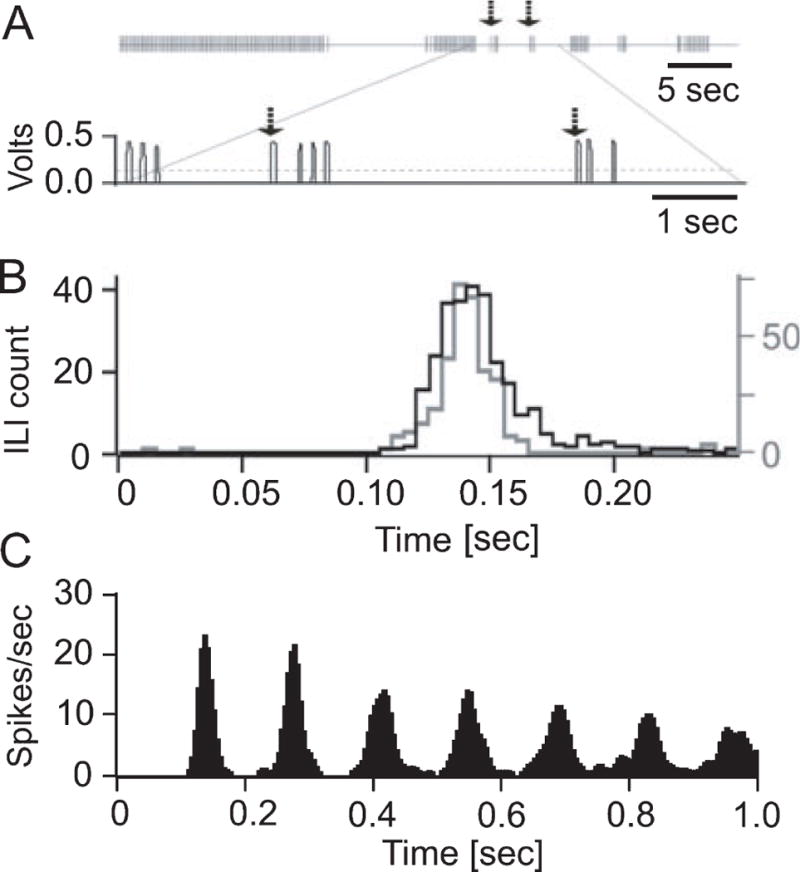
Temporal structure of licking behavior in mice. (A) A typical raw data example of mouse licking behavior recorded during head fixation. Each vertical line in the upper trace represents one lick. The lower trace shows the raw lick voltage signals corresponding to the area in the upper trace indicated by the lines. The dashed line indicates the voltage threshold used to detect lick times at the ascending slope of the voltage step, i.e. at the beginning of the tongue to waterspout contact. Typically mice licked in bursts of licks with the number of licks per burst being highly variable. The upper row in Fig. 1 shows 7 lick bursts. In the lower trace the last few licks of the second burst and the short 3rd and 4th bursts are shown Arrows in the upper and lower trace mark the onsets of 3rd and 4th lick bursts. (B) Inter-lick interval distributions of licking behavior recorded prior to surgery (black histogram) and during a typical experimental session (gray histogram) involving head fixation and recording of neuronal activity. The two distributions are nearly identical, demonstrating that head fixation did not affect the licking rhythm. (C) The autocorrelation analysis of the licking behavior shown in (A) exhibits multiple equidistant side peaks, indicative of a highly regular lick rhythm.