
Figure 2.
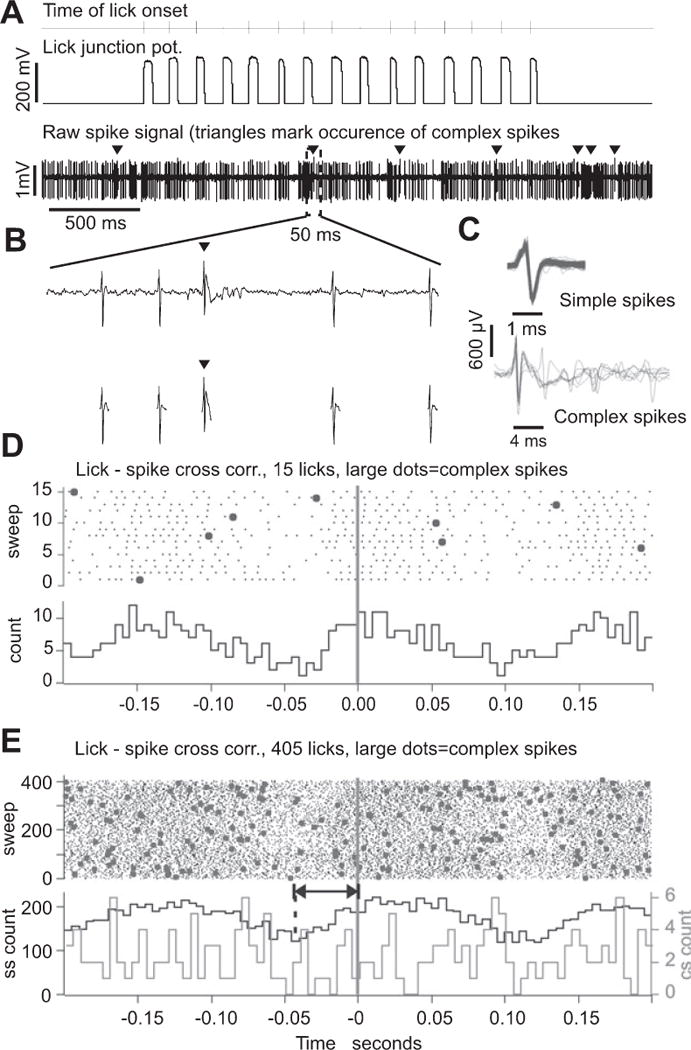
Correlation between Purkinje cell spike activity and licking behavior.
(A) Top trace: tick-marks show the times of lick onset, i.e. the time when the tongue touched the water spout. Middle trace: raw junction potential signals generated by 15 licks. Lower trace: simple and complex spike activity of a Purkinje cell recorded simultaneously with the licks. Arrowheads mark the occurrence of complex spikes. (B) Top trace: expansion of the raw spike signal containing four simple and one complex spike. Bottom trace: cutouts of simple and complex spikes after spike sorting based on differences in spike shapes. (C) Ten superimposed simple spikes (top) and ten superimposed complex spikes (bottom) from the data shown in (A) and (B). Voltage scale applies to both sets of traces, time scales are different. (D) Lick-spike cross correlation calculated for the burst of 15 licks and the segment spike activity shown in (A). Zero marks lick onset time, i.e. the time of tongue to spout contact. The large dots in the raster plots represent complex spikes. (E) Lick-spike cross correlation calculated for the same Purkinje cell but for >400 licks, including the 15 shown in (A). Bin width for both cross correlation histograms is 5 ms.