
Figure 3.
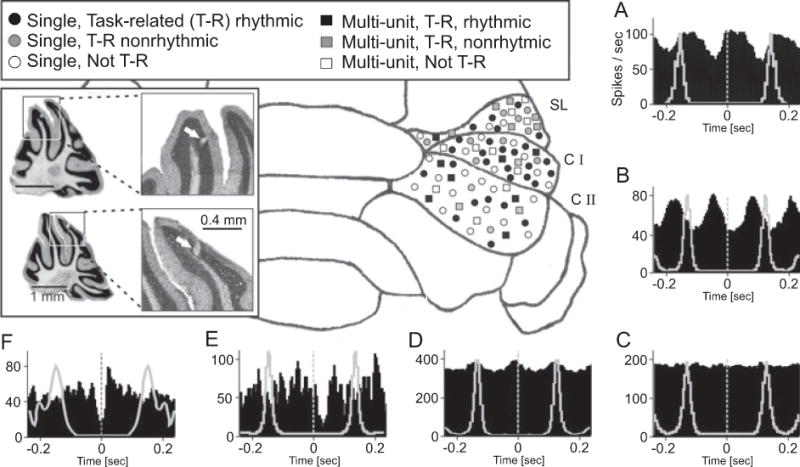
Neuronal representation of licking behavior in the cerebellar hemisphere. Summary of electrophysiological results showing recording locations and classifications of Purkinje cell activity recorded during licking behavior.
(A–F) Cross-correlation analysis (black histograms) of simple spike and licking behavior revealed different classes of Purkinje cells defined by different temporal relationships between Purkinje cell activity and licking. To illustrate the phase relationship between spike modulation and lick rhythm the autocorrelogram of the licking behavior is plotted with gray lines in each correlation histogram. The neuronal activity recorded during licking was categorized as described in details in the main text. Examples show are: (A) Lick-related, rhythmically modulated single unit; (B) Lick-related, rhythmically modulated multi-unit recording; (C) Not lick-related, Multi-unit; (D) Lick-related, weakly modulated rhythmic multi-unit; (E) Nonrhythmic, lick-related multi-unit; and (F) Nonrhythmic, lick-related single-unit. The symbols in the schematic map of the cerebellar cortex represent the different response types described in the legend and indicate the approximate recording site. The inset shows photomicrographs of Nissl stained 50 μm sagittal slices with electrolytic lesions marking recording sites. Top: lesion in the simple lobule, Bottom: lesion in Crus I. Bin width in all histograms is 5 ms. Histograms were smoothed with a 3 point Gaussian. SL= Simple Lobule, CI = Crus I lobule, CII = Crus II lobule.