
Figure 6.
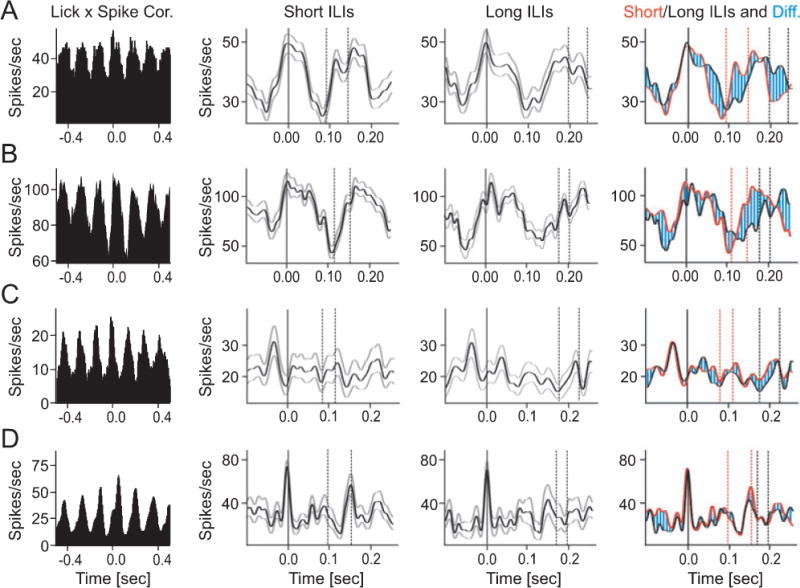
Inter-lick interval duration is represented in Purkinje cell simple spike activity. The average firing rates of four rhythmically modulated lick-related Purkinje cells (A–D) were calculated separately for the 30 shortest and 30 longest inter-lick intervals (ILIs) in the data set. The histograms in the left column show the lick-spike correlations (all licks included) for the four units. The center two columns show average spike rate trajectories (black curves) recorded during short (center left) and long (center right) ILIs. Gray curves mark +/− one standard deviation. Solid vertical lines in each histogram mark the times of tongue to water spout contact, dashed vertical lines delimit the time intervals within which the next tongue contact occurred. The right-most column shows an overlay of the data in the two center columns with responses during short ILIs shown in red, responses during long ILIs shown in black and the difference hatched in blue. The time course of the spikes rates of units (A) and (B) were different during long and short ILIs. Spike rate minima and maxima occurring earlier during short ILIs than during long ILIs. Units (C) and (D) generated similar spike rate patterns during long and short ILIs. All of the cross correlations contained 5 ms bins that were smoothed with a 3-point Gaussian function.