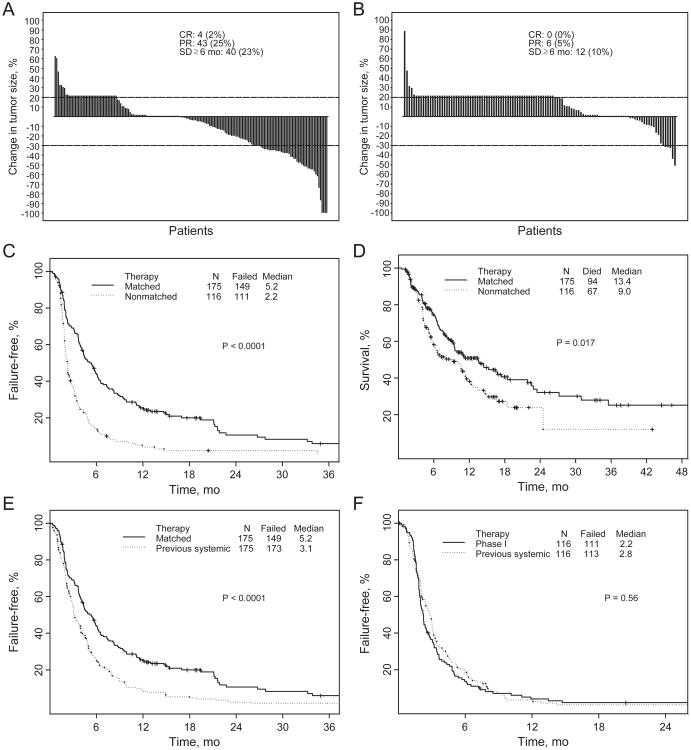
Figure 3.
A, best response by RECIST of 175 patients with one molecular aberration treated with matched therapy: changes from baseline in tumor measurements (waterfall plot). Patients with new lesions and/or clinical progression were illustrated as 20% progression (≥20% increase indicates progression; >30% decrease indicates partial response). B, best response by RECIST of 116 patients with 1 molecular aberration treated without molecular matching: changes from baseline in tumor measurements (waterfall plot; ≥20% increase indicates progression; ≥30% decrease indicates partial response). C, TTF of patients with 1 molecular aberration [matched targeted therapy: n = 175, median TTF = 5.2 months (95% CI, 4.3–6.2); therapy without matching: n = 116, median TTF = 2.2 months (95% CI, 2.0–2.7; P < 0.0001)]. D, survival of patients with 1 molecular aberration [matched targeted therapy: n = 175, median survival = 13.4 months (95% CI, 9.5–18.5); therapy without matching: n = 116, median survival = 9.0 months (95% CI, 5.9–11.7; P = 0.017)]. E, TTF of 175 patients with 1 molecular aberration treated with matched therapy (median, 5.2 months; 95% CI, 4.3–6.2) versus prior therapy (median, 3.1 months; 95% CI, 2.8–4.0; P < 0.0001). F, TTF of 116 patients with 1 molecular aberration treated with nonmatched therapy (median, 2.2 months; 95% CI, 2.0–2.7) versus prior therapy (median, 2.8 months; 95% CI, 2.2–3.2; P = 0.35).

