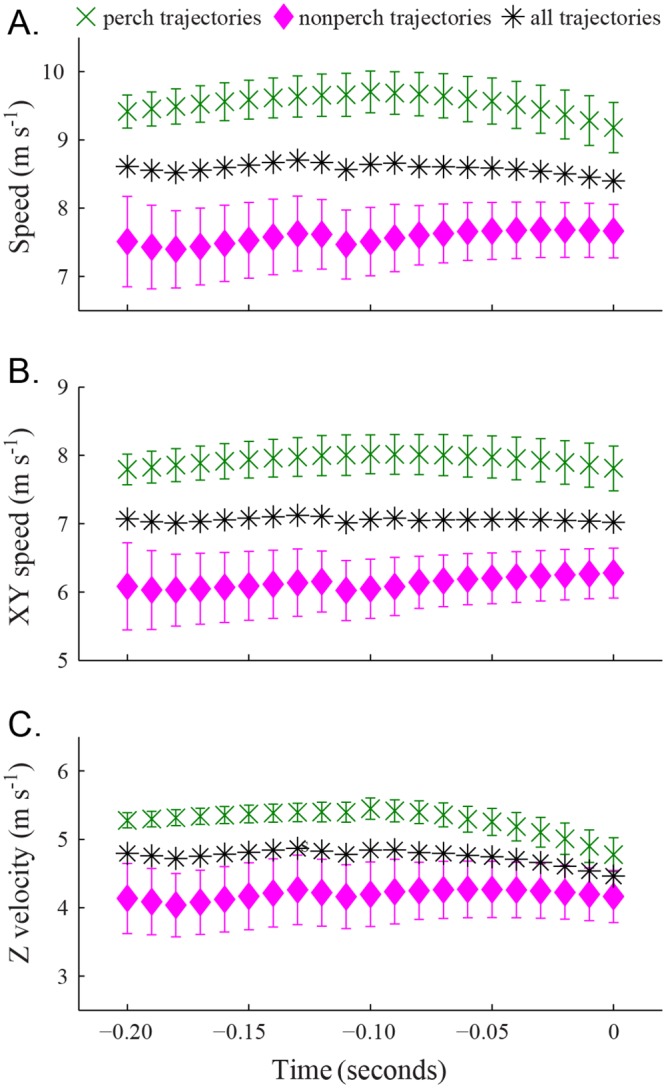
Fig 4. Flight speed in defending trajectories.

The green cross markers show the mean flight speed of defending birds that approached the feeder from a frequently-used perch. Error bars show the standard error (n = 16 trajectories at t d = 0 and n = 15 at t d = 0.11 seconds). The pink diamond markers show the mean flight speed of all other defending trajectories (n = 17 at t d = 0, n = 15 at t d = 0.09 seconds, and n = 11 at t d = 0.11). The black asterisk markers show the mean flight speed of all defending birds (n = 33 at t d = 0, n = 30 at t d = 0.09, and n = 26 at t d = 0.20 seconds). (A) Gives the overall flight speed while (B) shows speed in the horizontal (XY) projection of the trajectories and (C) shows vertical velocity. Note that a positive vertical velocity is downward toward the ground and feeder. The trajectories were combined using a common t d where 0 is the time at which the trajectory passed through Z = -1.2 m.
