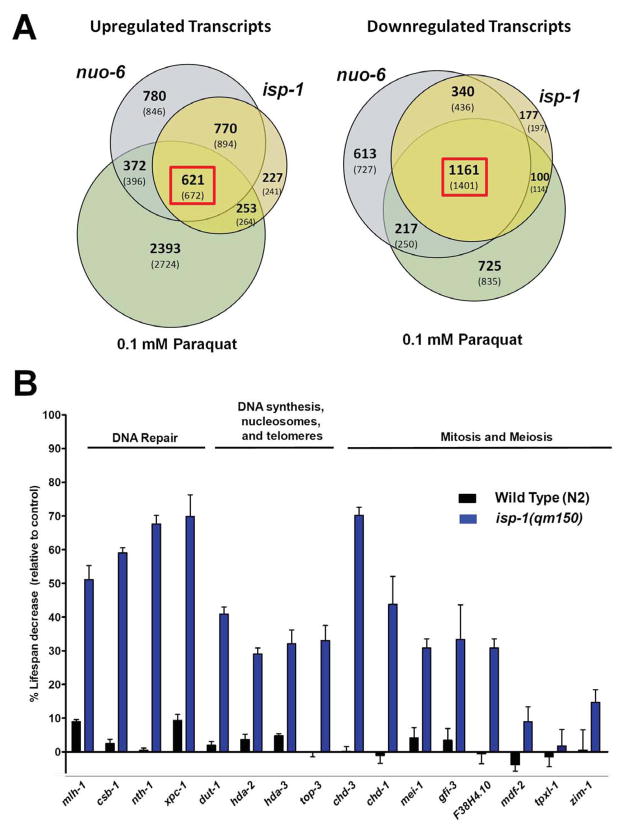
Figure 1.
Whole genome expression profiling of isp-1 and nuo-6 mutants, and the wild type treated with 0.1mM paraquat. A) Venn diagrams illustrating the number of significantly up-regulated or down-regulated transcripts found in each condition tested when compared to untreated wild type. Bolded numbers represent the actual number of probes whose expression was significantly changed relative to wild type expression, while numbers in brackets represent the maximum number of different transcripts that could be detected as a result of high homology. B) Lifespan changes resulting from treatment of wild type and isp-1 mutants with RNAi against genes that are up-regulated in all three conditions and whose activities are expected to be involved in genome stability. The majority of genes had large effects on the mutant but no, or very little, effect on the wild type. Bars represent the degree of lifespan shortening relative to control and error bars represent SEM. See also Figures S1, S2, S3; Tables S1, S2, S3, S4 and S6. Numerical values and statistical analyses for all lifespan experiments are presented in Table S5. The GEO ascension number for all gene array data in this paper is GSE54024.

