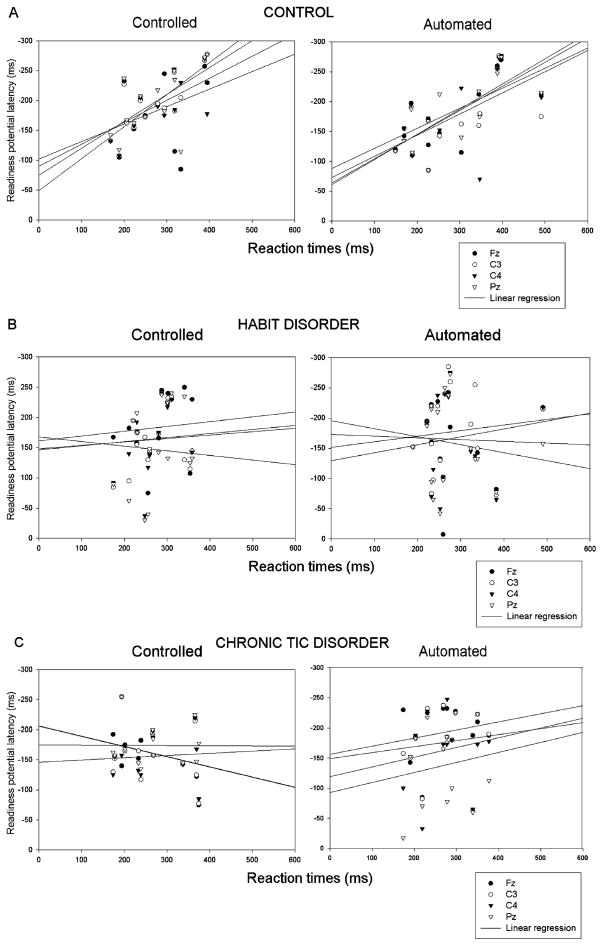
FIGURE 4.
Group comparison illustrating the relationship (linear regression) between the readiness potential and the reaction time latency for each electrode pooled across blocks in controls (A), Habit Disorder (B), and Chronic Tic Disorder (C) groups. The control group showed a significant relationship between the readiness potential and the reaction times that was not found in either clinical group.

