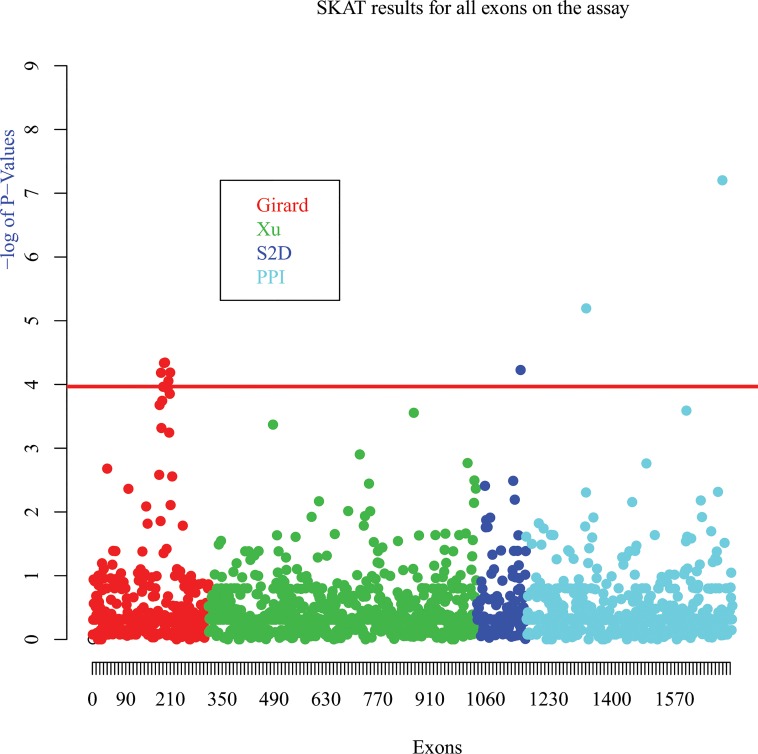
Fig 2. SKAT results for all exons on the assay.
SKAT analysis were performed using only rare variants (< = 1%) and using exons as sets. The data sources are shown by the colors (Girard et al. = red, Xu et al. = Green, S2D project = Blue, Protein:Protein Interaction = Cyan). P-values significance threshold was set to 1.0 * 10−4 using simpleM method.

