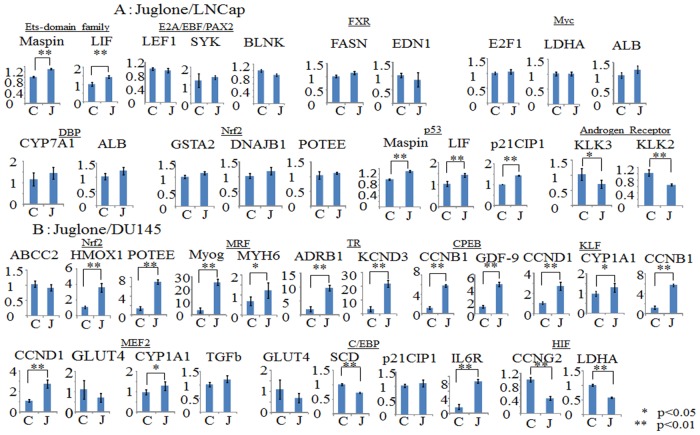
Fig 5. Real-time PCR is applied and relative gene expression levels are determined by the comparative Ct method.
Bars indicate the means±S.E. of the ratios of the relative expressions of the target mRNAs to that of GAPDH. The mean of the control is arbitrarily set at 1. Statistical significance is indicated by * (p<0.05) or ** (p<0.01). A. LNCap cells were incubated with control solvent (C) or 10 μM Juglone (J) for 48hr. B. DU145 cells were incubated with control solvent (C) or 10 μM Juglone (J) for 48hr.

