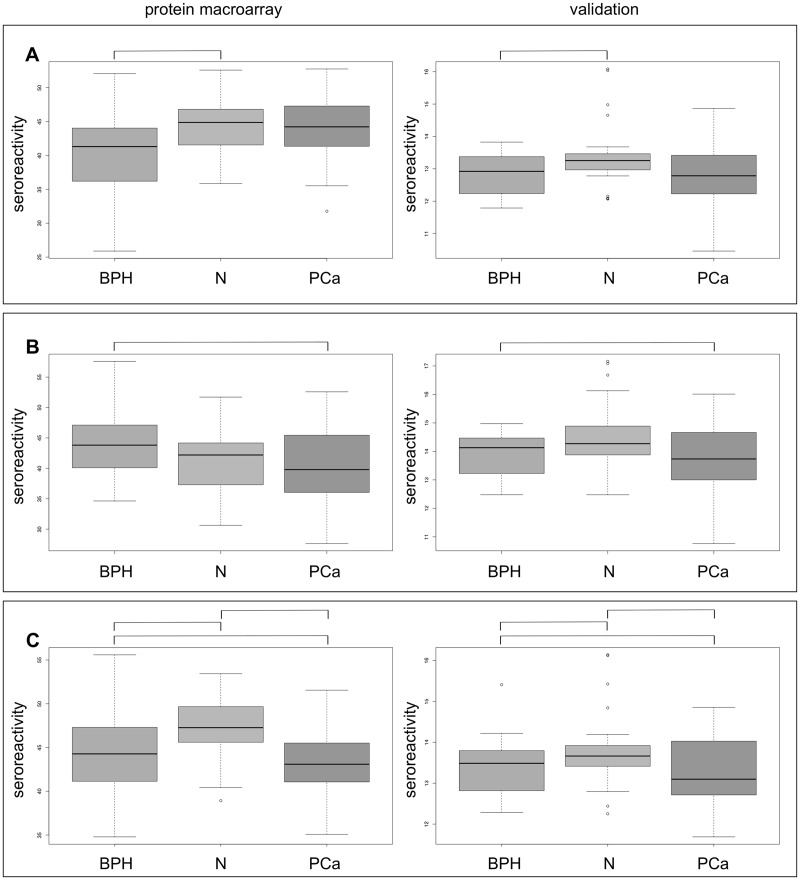
Fig 2. Seroreactivity against DDX54, RPL7 and RPL15 in protein macroarray and Luminex validation.
Box-Whisker plots for reactivity against DDX54 (A), RPL7 (B) and RPL15 (C) with serum of patients with benign prostate hyperplasia (BPH), prostate carcinoma (PCa) and healthy controls (N) in protein macroarray (left panels) and luminex validation (right panels). For each group, the boxes indicate the 2. and 3. quartile of seroreactivity, the whiskers show minimum and maximum value. The horizontal black lines indicate the median seroreactivity in the group. Similar seroreactivity trends are indicated by square brackets.

