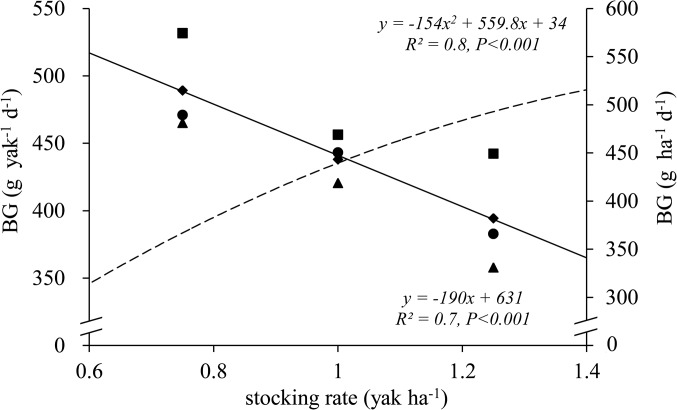
Fig 5. Relationships between stocking rate (i.e. stocking rate in yaks ha-1 grazing season-1) and liveweight gain (LG) of yaks (left y-axis, g yak-1 d-1) and area-based LG of yaks (right y-axis, g ha-1 d-1).
Solid lines show LG per yak (g yak-1 d-1), and long-dashed regression lines show LG per ha (concentrations × SR, g ha-1 d-1).Circles (●), triangles(▲), squares(■)and rhombuses (◆)represent the 2010, 2011, 2012 and 2013, respectively. Study site was located in an alpine meadow, Qinghai–Tibetan Plateau.

