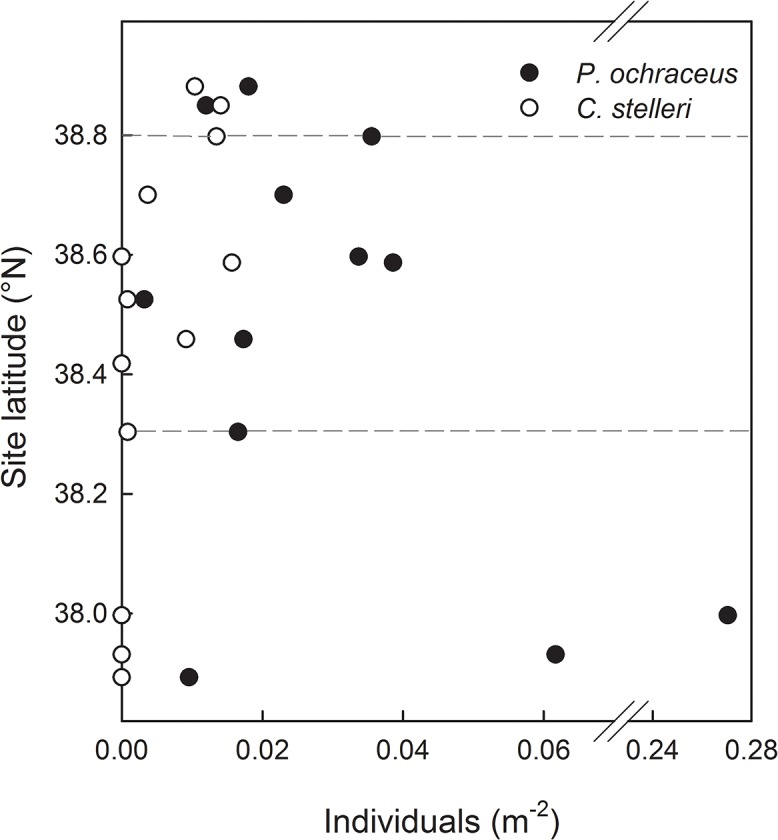
Fig 7. Post-event densities of P. ochraceus and C. stelleri.

Data are from swath transects, shown by site latitude. Despite many carcasses of these species being observed on shores during the die-off, surveys did not show consistently depressed density within the impact zone (defined by the loss of S. purpuratus and Leptasterias sp. and indicated by dashed lines). See S3 Table for raw counts and area surveyed per site.
